Author Archives: Maarten Moerman

Observium, eBay Classifieds and the Origin of Its Alerting System

I’ve been using Observium for a very long time. Looking through this
site recently, I realised that quite a few of my old Observium articles
are still online, but I’ve never really written down how I became
involved with the project in the first place.

It goes back to my time at eBay and eBay Classifieds Group, where I was
working on the network infrastructure behind businesses including
Marktplaats.nl.

At that scale, monitoring obviously wasn’t optional. We had a large
amount of network infrastructure and needed to know not only whether
devices were reachable, but what was actually happening inside the
network: interfaces, BGP sessions, processors, memory, storage, sensors
and all the other things that can tell you that something is going wrong
before it becomes visible to users.

I came across Observium, which at the time was still a relatively
young project being developed primarily by Adam Armstrong.

I got to know Adam quite well as we started using Observium more
seriously and became more involved with its development, and over the
years I’ve come to consider him a personal friend. At the time, though,
the reason I became interested in Observium was simply that I liked its
approach to network monitoring.

It was very good at automatically discovering what was actually present
on a device. Instead of spending huge amounts of time manually defining
every interface, sensor and BGP session, Observium could discover the
network and build a useful picture of it automatically.

We started using it, and I became increasingly involved with the
project.

One of the things that was missing at the time was a proper alerting
system.

Observium was already very good at showing you the state of a network,
but in a production environment we also needed it to actively tell us
when that state changed in a way that required attention. Monitoring
something and periodically looking at a graph is one thing; knowing
immediately that a BGP peer has gone down or that an important resource
has crossed a threshold is another.

Through eBay/Marktplaats, I sponsored development of Observium and
specifically had the original alerting functionality developed.

The idea was to build alerting around the entities Observium was already
discovering. Rather than maintaining a completely separate set of
monitoring definitions, alerts could operate on things Observium already
understood: devices, ports, BGP peers, processors, memory, storage and
sensors.

That eventually became the entity-based alerting system.

Once it existed, the next problem was actually configuring it properly.

The alerting system was flexible, but that also meant you needed to
understand its metrics, attributes, conditions and association rules.
There weren’t many ready-made examples available at the time, so in 2014
I wrote “Useful Observium alert checker examples” on this site.

That article contained examples for the things I thought most network
operators would actually want to monitor: devices going down, CPU and
memory utilisation, BGP sessions, interface errors and discards, storage
utilisation, traffic levels and sensors.

Looking at it again more than a decade later is quite interesting
because the terminology and implementation have evolved, but much of the
basic alerting model is still recognisable.

Alerting continued to develop after that.

One limitation of the original system was that it was poller based. If
the poller ran every five minutes, there were some events that you
either wouldn’t see immediately or couldn’t sensibly detect through
polling at all.

That led to another feature I was interested in: syslog alerting.

When that became available in Observium, I wrote another article
explaining how to use it. Syslog alerting made it possible to react in
real time to messages generated by network devices—for example OSPF
events, duplicate IP or MAC-address warnings and other conditions that
don’t fit naturally into normal SNMP polling.

Over the years I wrote several other Observium-related articles and bits
of documentation, and maintained some of the material as the software
changed.

I wasn’t one of Observium’s developers, and I don’t want to rewrite
history to suggest that I was. Adam and the other Observium developers
built the software. My involvement was from the other side: I was
running networks, using the software in a real production environment,
sponsoring development of functionality we needed and helping document
how some of it could actually be used.

The alerting system was probably the most substantial part of that
involvement.

Observium has developed enormously since then. The current system has
alert checkers, notification transports, scheduled maintenance, an API,
syslog alerting and considerably more functionality than the version we
were working with at the time.

It’s nice to see that something we needed for our network more than a
decade ago became part of a monitoring system that is still actively
developed and used today.

And it’s also why there are so many old Observium posts scattered around
this website.

I wasn’t writing them as blog content.

I was writing down how we got things to work.

From Videotex to the Internet: My Early Years at Agrotel

My first professional job in IT was at Agrotel, in the 1990s.

Looking back at it now, it was a good moment to start working with
computers because the technology we were using was changing underneath
us. I started as a programmer in an environment that had been built
around Videotex, and during my time there the Internet and World Wide
Web were rapidly taking over.

Agrotel had been around before I joined. Its roots were in agricultural
electronic information services that predated the Web. Information was
distributed through Videotex, or VTX, allowing users to connect to
central services and retrieve pages of agricultural information
electronically.

By the time I was working there, however, it was obvious where things
were going.

The Internet was growing quickly and the Web provided a much better way
of distributing information. The problem was that there was already a
lot of useful information and data sitting in systems designed for the
old environment.

One of the things I worked on was software to automatically convert
information from the existing systems into HTML. One of my programs was
simply called DAT2HTML — a conversion program that took data
intended for the old information environment and generated webpages from
it.

Some of that program’s output has, somewhat accidentally, survived on my
website to this day.

There is an old test page in /grafiek/ whose original HTML title is
still “Agrotel Conversie programma DAT2HTML.” It generates a
graphical presentation of a series of values using HTML and tiny GIF
elements — very much the way these things were done before browsers
had SVG, Canvas, JavaScript charting libraries or any of the tools we’d
use for the same job today.

https://www.maartenmoerman.nl/grafiek/TEST.HTM

There is even an old WS_FTP.LOG sitting next to it. It shows the files
being transferred on 14 January 2004, first involving a backup under my
Windows profile and later being uploaded to /home/mgm/www/grafiek on
one of my machines.

The files themselves may be older — the log refers to them as coming
from a backup — so I don’t regard 2004 as the date I originally wrote
DAT2HTML. But it is a nice little timestamp that happened to survive
with the files.

https://www.maartenmoerman.nl/grafiek/WS_FTP.LOG

DAT2HTML is a good example of the sort of software I was writing at the
time. We already had information and data in systems built around an
earlier generation of online services, while the Web was becoming the
place where that information needed to be. Rather than manually
rebuilding everything as webpages, I wrote tools to automate as much of
that process as possible.

Looking at the output today is quite funny. Generating a graph using a
collection of tiny GIF files and HTML layout is obviously not how anyone
would approach the problem now. But browsers and HTML were considerably
more limited, and getting information from one system onto the Web often
meant simply inventing a practical way of doing it with what was
available.

The programming also brought me increasingly into contact with the
infrastructure underneath it. If we were going to provide these services
over the Internet, we needed the servers, connectivity, DNS, mail and
networking to actually run them.

So alongside writing software, I became involved in building an **ISP
environment**.

That was probably where my later career in network engineering really
started. I began as a programmer, but I found myself spending more and
more time with Unix systems, servers and networking.

I still have other remnants from those days online. There is, for
example, an old maarten.agroweb.nl Christmas page from 2000 sitting on
this domain, complete with my old @agroweb.nl email address.

It is a small surviving piece of a very different Internet.

Connections were slower, servers were physical machines you actually
knew, and if you wanted a service to exist there was a reasonable chance
you would end up configuring much of the infrastructure yourself.

Agrotel itself went through later organisational changes. One thing I do
want to make clear, because some online employment databases get this
wrong, is that I worked for Agrotel.

I did not work for the later Agroportal organisation. That came
afterwards.

After Agrotel my career moved further into Internet infrastructure. I
later worked at Solcon, where operating Internet infrastructure was
the actual business, and eventually moved almost entirely into network
engineering.

Years later I would be working on BGP, MPLS, data centres and network
automation for eBay and eBay Classifieds Group.

But a surprising amount of it started with trying to get agricultural
information out of an old information system and onto this new thing
called the World Wide Web.

At the time, of course, we didn’t think of it as Internet history.

It was just the new system we were building.

Maarten Moerman

Maarten Moerman is a Dutch technology specialist, entrepreneur and collector whose career has largely revolved around software, the Internet and network infrastructure, alongside longstanding interests in photography, classic cars and motorcycles, engineering and restoration.

He began his professional career as a programmer in the 1990s, at a time when the Internet was only beginning to become commercially established in the Netherlands. His first company was Agrotel, an agricultural information service whose technological roots went back to the pre-Web era.

Agrotel distributed information through Videotex, or VTX, an interactive electronic information system that allowed users to retrieve pages of information long before websites became commonplace. As the World Wide Web began to replace systems such as Videotex, Moerman worked on automating the transition, developing software that could take information from the existing VTX environment and make it available on the Internet.

It was an early introduction not only to programming for the Web, but to the infrastructure required to make Internet services work. Hosting an online service at the time often meant building much of the environment around it as well. Moerman became involved with servers, connectivity and the construction of an early ISP environment, and his interests gradually shifted from the software running on the Internet towards the networks underneath it.

He later joined Solcon, one of the early independent Internet service providers in the Netherlands. Working for an ISP put networking and Internet infrastructure at the centre of his professional work, and network engineering became his main technical field.

That eventually took him to eBay, where he worked as a Senior Network Engineer and later became Manager of Network Engineering at eBay Classifieds Group. There he worked on the network and data-centre infrastructure supporting a number of international online marketplaces.

The work covered large IP networks, BGP, MPLS, L3VPNs, data-centre networking and the increasing automation and virtualisation of infrastructure. A Juniper Networks case study from this period identifies Moerman as Manager of Network Engineering and describes eBay Classifieds Group’s move towards software-defined networking, combining its existing MP-BGP and L3VPN architecture with Juniper Contrail and QFX data-centre switching.

During the same period, Moerman became involved with Observium, the network-monitoring platform. Through his work at eBay and Marktplaats.nl, he sponsored development of the project and commissioned the implementation of its original alerting system, extending Observium from network discovery and monitoring into active infrastructure alerting. He also contributed documentation and practical monitoring examples to the project and remained involved with Observium and related tooling in later years.

Outside work, cars had been a longstanding interest, particularly older Audis and the five-cylinder quattro models of the 1980s.

By the early 2000s Moerman was active in Dutch and international Audi communities including Audiforum.nl, AudiWorld, S2Forum, MotorGeek and Classic-Audi. His involvement with Audiforum.nl went beyond posting about cars: he was also involved in running the forum’s technical hosting and infrastructure.

His own cars over the years included a number of Audis, among them a TT 1.8T quattro and several older Type 81/85 models. Much of his interest centred on the engineering of the early quattro cars and the interchangeability and differences between the various models.

During this period he also helped his friend Jeffry with the construction of a Sport quattro. The project ran for several years and involved finding original and difficult-to-source parts, working on the car and researching the mechanical differences between the Coupe quattro, Ur-quattro and Sport quattro. The project appears extensively in the Audi forums of the period and eventually reached the road and dyno.

Moerman’s interest in automotive history extended beyond his own cars. Among the subjects he researched was Petermax Müller, the German engineer and racing driver known for his Volkswagen-based competition cars. He collected historical information and photographs and shared material with other enthusiasts online.

Classic BMW motorcycles became another interest during the following years. Moerman restored and built several older BMWs, with projects documented on Motor-Forum.nl and ADVrider. The work ranged from restoration of early single-cylinder machines to later boxer-based projects and involved both mechanical restoration and fabrication.

Photography developed alongside these interests and gradually became a larger part of his life, particularly analogue cameras and older photographic lenses.

Around 2016, another restoration project began on a rather different scale.

Moerman bought a former drinking-water pumping station in Elburg, which had become redundant and was being sold by Vitens. He subsequently converted the building into his home.

The history of the building could be traced back to the immediate post-war period. It was designed in 1948 as the Pompstation te Elburg for N.V. Waterleiding Maatschappij Gelderland (WMG), Doetinchem.

Its architect was Cornelis Nap of Arnhem, with G. van Ede named on the original plans as his medewerker. Van Ede later became Nap’s partner in the architectural practice Corn. Nap en G.J.P. van Ede, which was responsible for a range of buildings during the post-war reconstruction period.

Although designed as a functional waterworks building, the pumping station received a considered architectural treatment and a number of details that remain visible today. Before its conversion, its cultural-historical value was assessed, and in 2016 the municipality agreed to changing the site’s use from a water-company/business function to residential use.

A few years after acquiring the building, Moerman began looking for more information about its architect. He eventually traced the successor to the architectural practice that had inherited the old Nap and Van Ede archive.

The small architectural office was clearing out its historical records at around the time he contacted them. Among the material that had survived were the original architectural drawings for the Elburg pumping station, dating from 1948.

Moerman was able to retrieve them and bring them back to the building for which they had originally been drawn, some seventy years earlier. The drawings are now kept in the former pumping station.

Meanwhile, his interest in photography had developed into Camera Obscura Elburg, a specialist business dealing in analogue rangefinder cameras, vintage lenses and collectible photographic equipment.

Leica forms an important part of the business, but Moerman’s interests range considerably wider. Camera Obscura deals in equipment from manufacturers such as Leica, Zeiss, Nikon and Canon as well as less common optics from companies including Zunow, Schneider, Rodenstock, Steinheil, Angénieux, Kinoptik, Dallmeyer, Hugo Meyer and others.

The business combines trading with research into photographic and optical history. Rare lenses can be poorly documented, and identifying them often involves comparing serial numbers, production changes, catalogues, patents and surviving examples.

That research also led to an interest in making older optics usable on Leica M cameras. Some lenses have optical characteristics worth preserving but were originally built for cameras or systems that are no longer practical to use. Converting them properly to Leica M can require entirely new mechanical components, including focusing mechanisms and accurately designed rangefinder cams.

Moerman began developing and commissioning new housings and components for such projects, combining vintage optics with newly manufactured mechanics.

In 2024 he introduced a newly manufactured rewind lever for Leica M film cameras, developed as a replacement for an accessory that had become increasingly difficult to obtain. CNC machined and produced in several finishes, it was designed for cameras including the Leica M2, M3, MP and M-A.

More extensive projects followed, including the Helios-M 58mm f/2, produced as a limited series in collaboration with RuhrlensWorx. The lens retains the optical system of the Helios 44-2 but places it inside a newly designed Leica M mechanism with rangefinder coupling, click-stop aperture operation and closer focusing.

Camera Obscura has since become a second professional activity alongside Moerman’s work in technology.

He continues to work with modern Internet and infrastructure technology, more recently in association with BetterBe, where his work has included networks, data centres, BGP, DNS, cloud infrastructure, Kubernetes and automation.

Programming has remained part of that work as well. One example is Sonnar, an inventory and invoicing system originally developed for Camera Obscura to deal with the particular requirements of trading second-hand equipment, including stock, trade-ins and margin-tax goods.

More than twenty-five years after starting as a programmer at Agrotel, Moerman’s work therefore still spans software and infrastructure, although on a very different scale from the early Internet.

Alongside it, the interests in older technology have remained. Cars and motorcycles, the former pumping station in Elburg, analogue cameras and vintage lenses all involve objects from different periods and on very different scales, but with a shared appeal: they were designed to be understood, maintained and used.

That has remained a fairly consistent part of Moerman’s interests. Whether working on Internet infrastructure, an old Audi, a BMW motorcycle, a post-war building or a mechanical camera, he has generally preferred to understand what is happening underneath the surface rather than treating technology as a black box.

Today he divides much of his professional time between IT infrastructure and Camera Obscura Elburg, while continuing to work on photographic projects, research older optical equipment and develop new mechanical solutions for cameras and lenses that in many cases have already been in use for half a century or more.

How to take Polaroid 8×10 large format photos

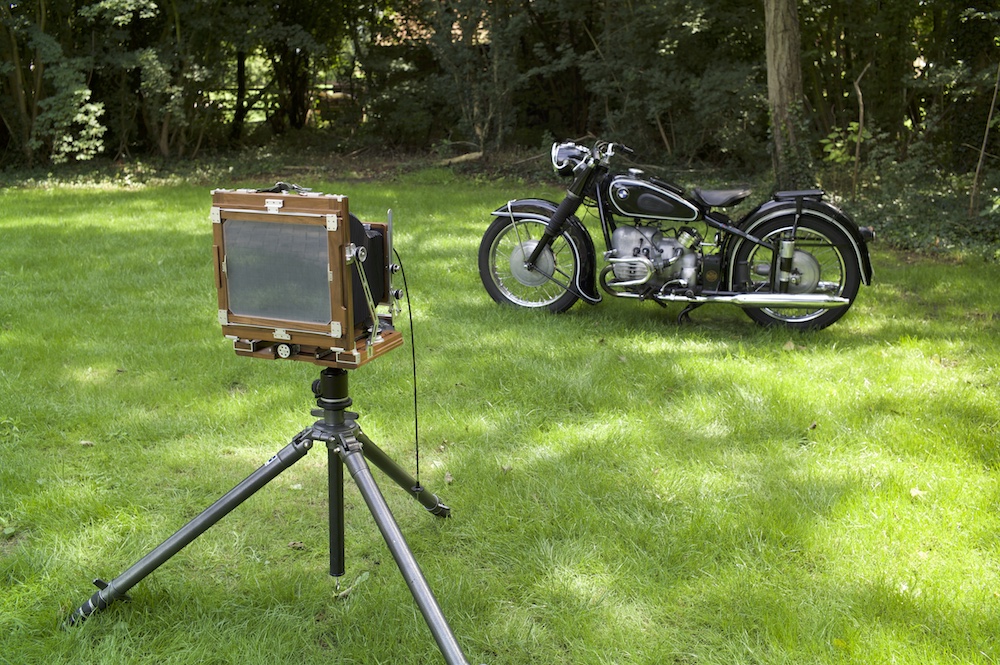
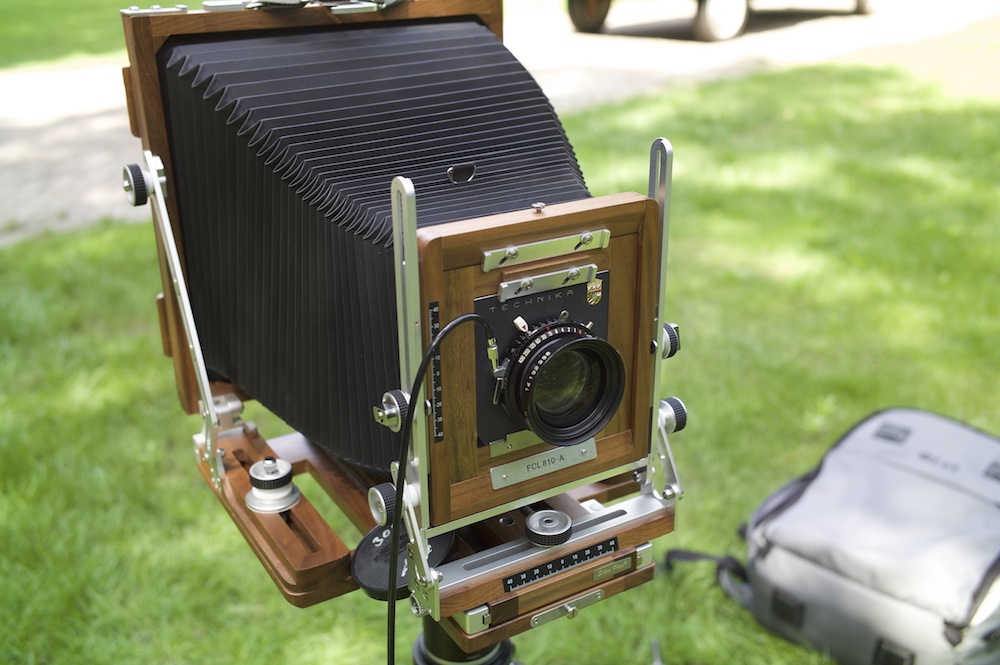
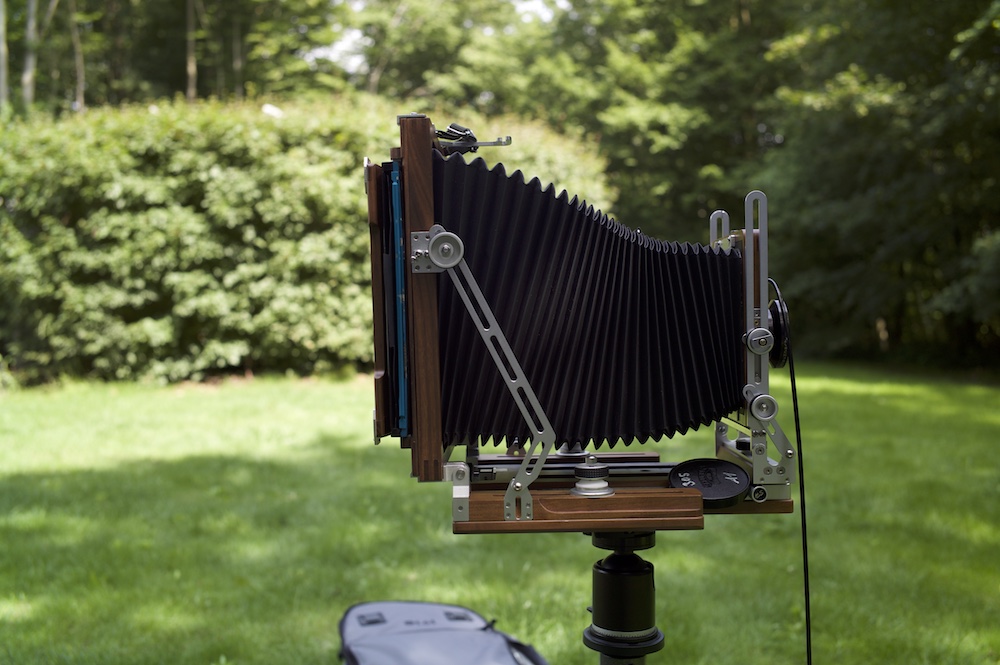
I bought a pack of Polaroid Impossible project to experiment with on a large format (8×10) camera. I used the Schneider Kreuznach G-Claron f9/305mm lens for taking this picture. The film was a 2019 stock, to be specific C008. The subject is a BMW R51/3 from 1953.

Shooting Polaroid 8×10 is a delicate process. For future reference, I created this manual/tutorial mostly for myself to go back to if I shoot it again, as there are many steps involved, and you don’t want to make mistakes with photo’s that cost 18 euro each.

Keep in mind that the environment/subject you are shooting needs to be as contrast free as possible, as Polaroid does not like too much contrast. The dynamic range is limited to around 3 stops. For reading the light I used the great and free Lux app on the iPhone. When metering, meter the whole scene if you want an even exposure across the image, if you would measure the light on say the chrome of the motorcycle, the blacks and shadows would not have any detail in the picture.

Polaroid 8×10 of BMW R51/3 – ISO640 / f16 / 1/15second

Prerequisites to taking a Polaroid 8×10 photo:

  • Make sure your film is out of the fridge at least 1 hour before making the picture
  • Polaroid film must be at correct temperature (advisable 17-23c)
  • Have a box of alcohol wipes ready
  • Ensure scene has not too much contrast
  • Setup the Polaroid processor in advance
  • Make sure the rollers of your processor are clean!
  • Have your light-meter ready
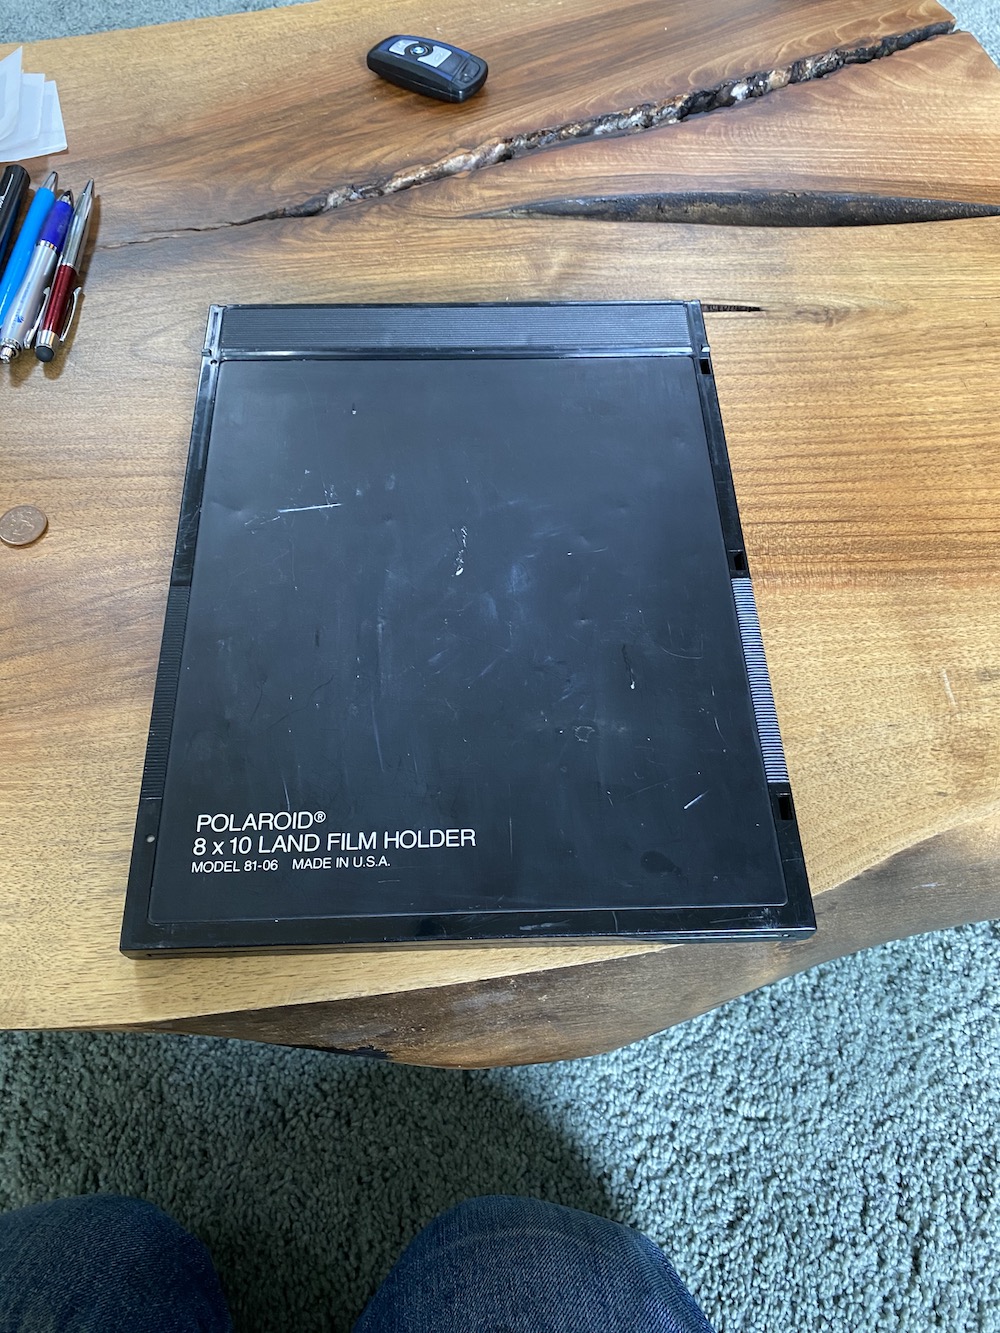
  • This tutorial assumes using a 81-06 film holder

1. Set up the subject to photograph

2. Set up the camera

  1. Do a light reading – keep in mind, Polaroid 8×10 is iso640 and allows for only +/- 1/3 of a stop, so pick a not so contrasty scene
  2. Setup the camera how you normally do

3. Setting up the film

  1. Ensure your film holder is clean and free from dust (alcohol wipes)
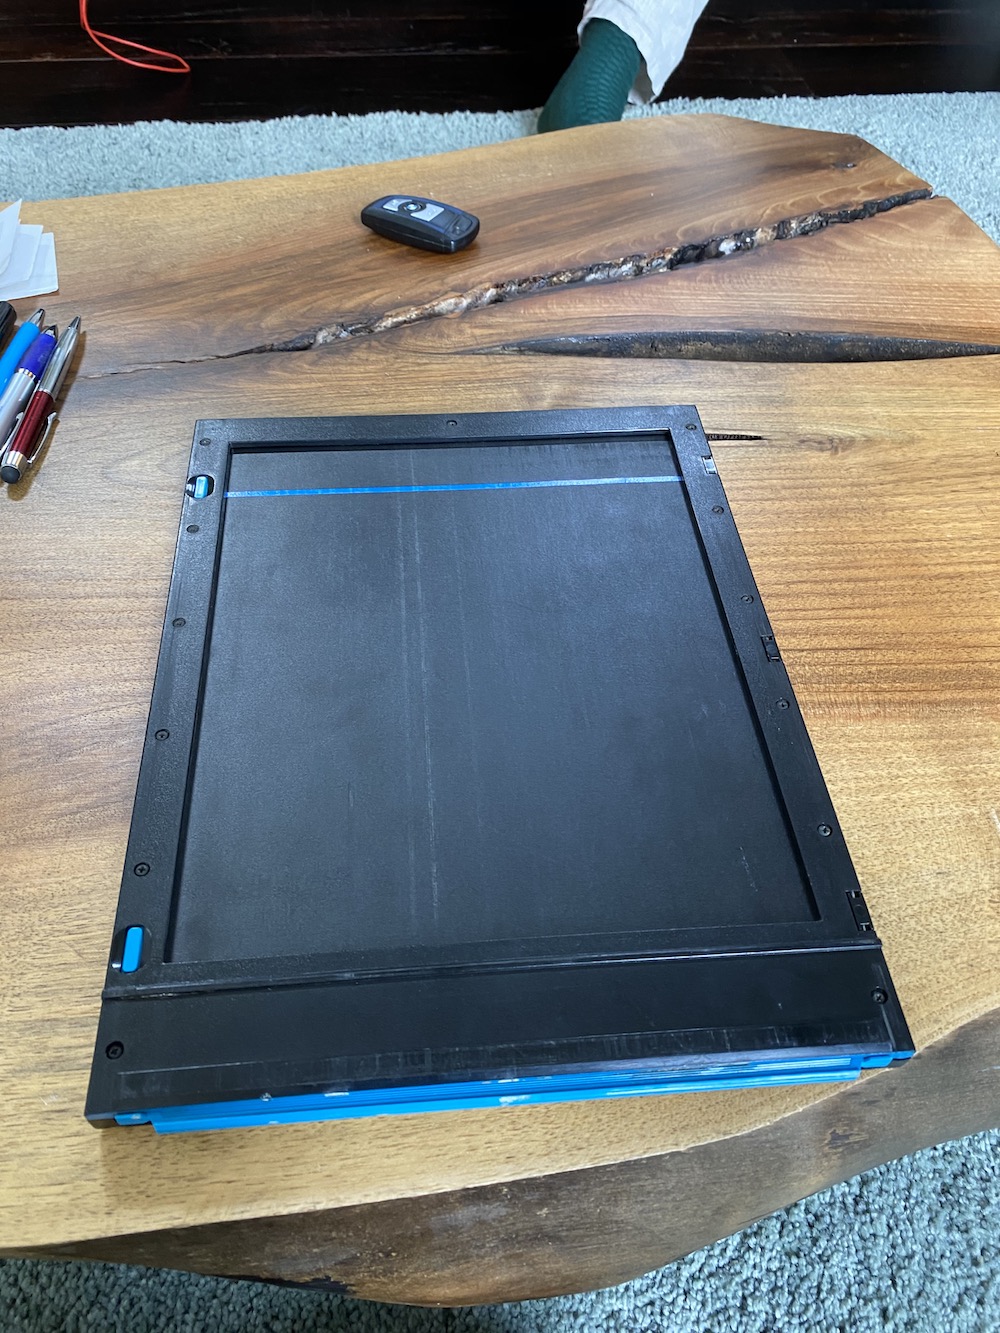
  2. Ensure your film holder has the dark slide inserted correctly (blue line facing away from the lens)
  3. Open up your film box, and take 1 envelop with a negative from the pack of sheets
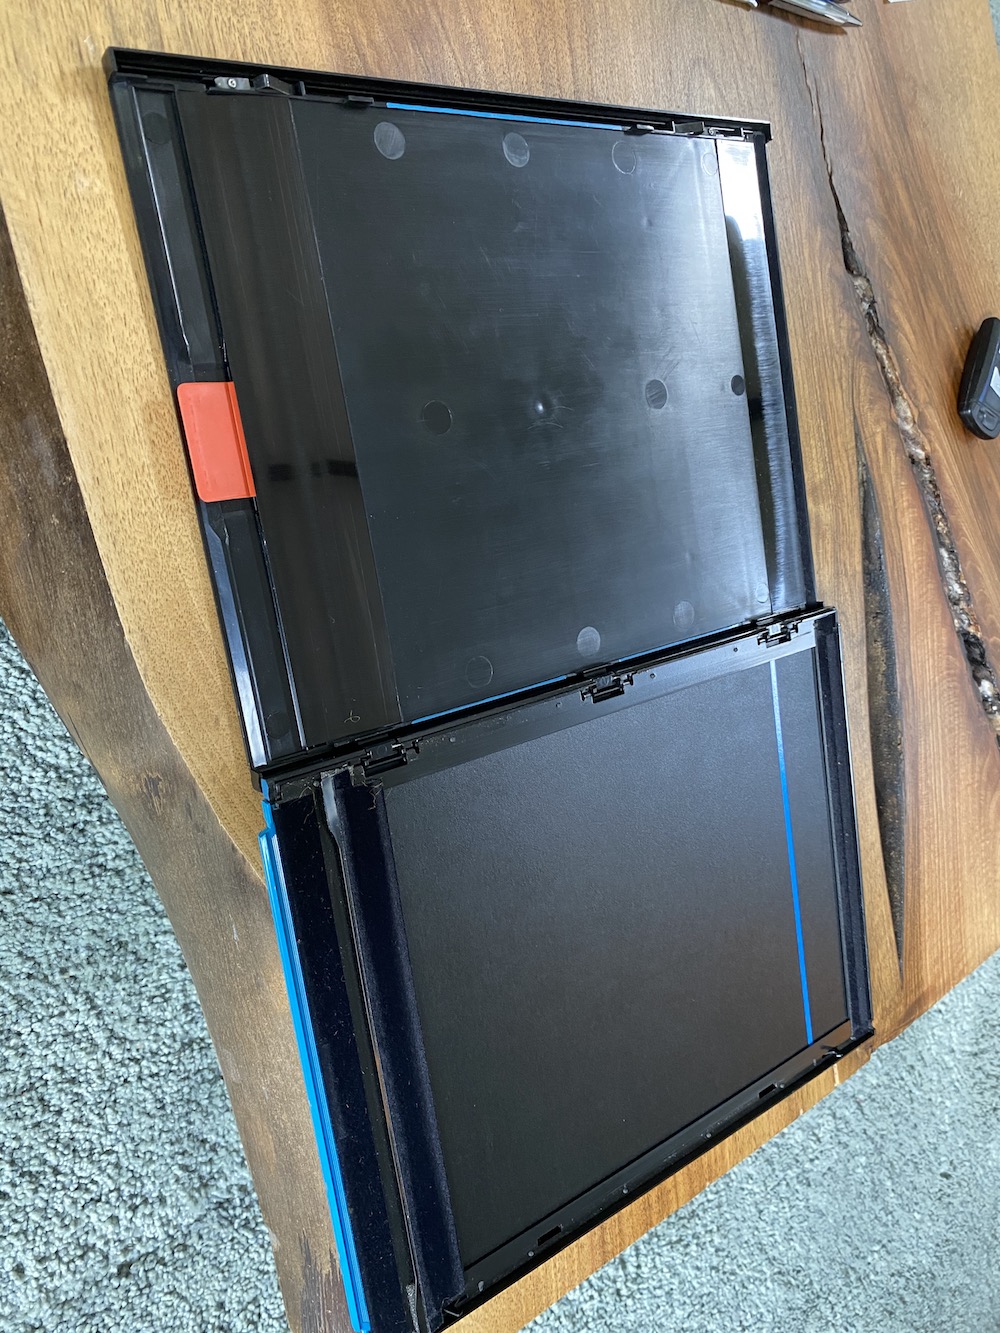
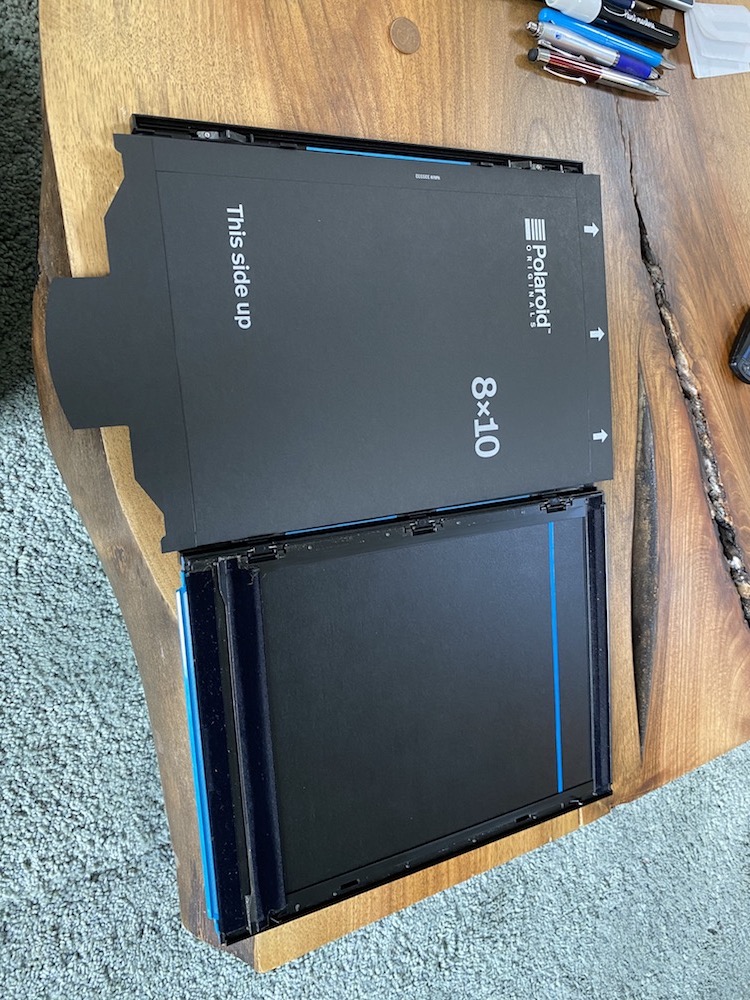
  4. Open the film holder
  5. Put the negative envelope in the part that has the red lip
  6. Lay film envelop on the opened Polaroid holder as per picture
  7. Ensure that the red tab engages with the film envelop and breaks the seal
  8. Close the film holder
  9. You now have a prepared film hold with a Polaroid negative in it


4. Taking the picture

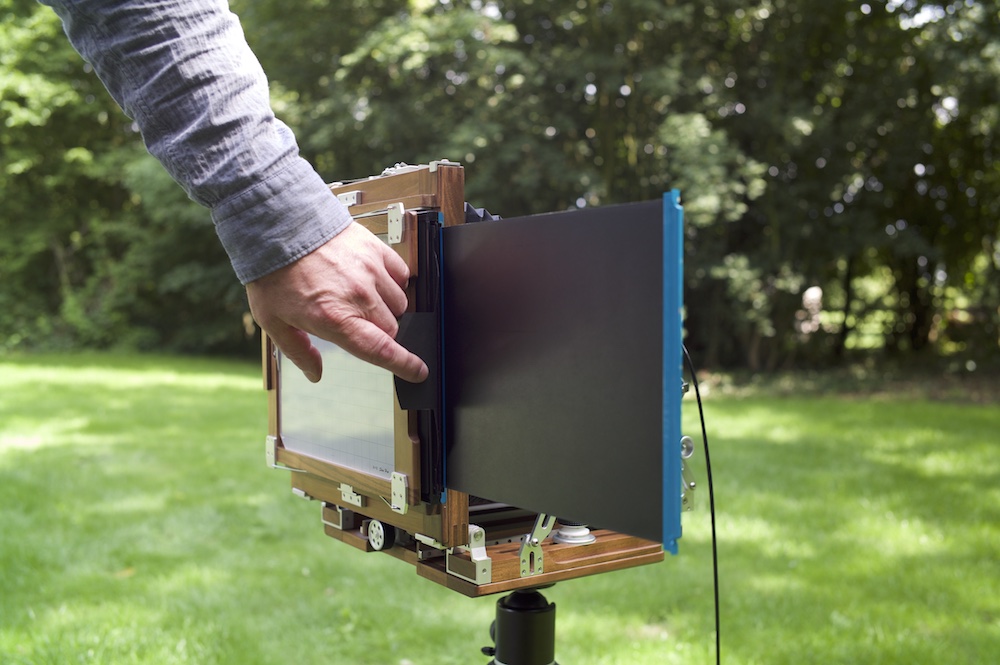
  1. Remove the envelope holding the negative while the envelope is in the holder, needs 2 hands
  2. Insert the film holder in the camera
  3. Double check your camera settings (lens closed, aperture & shutter speed set correctly)
  4. Do a final check of firing the shutter
  5. Cock the shutter
  6. Slide out the dark slide until the blue line becomes visible
  7. Do not fully remove the dark slide
  8. Take the picture
  9. Slide back in the dark slide
  10. Take the film holder from the camera
  11. You are done taking the picture


5. Processing the picture

  1. Take a positive sheet out of the Polaroid box while making sure you don’t touch the transparent part
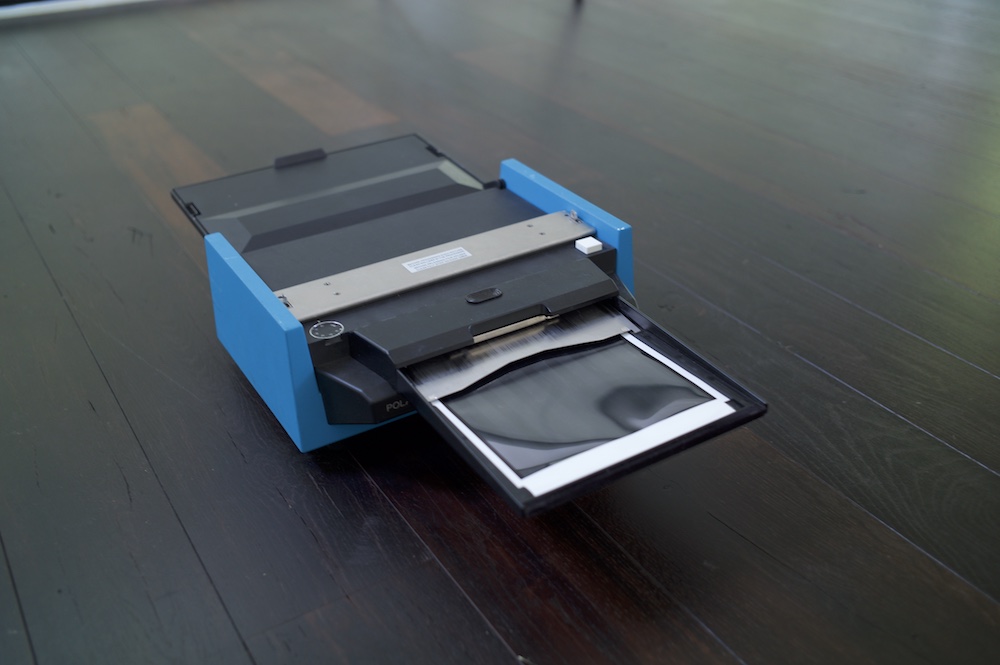
  2. Put the positive sheet in the processor, with the chemical packs going in first and facing up under the metal part(see picture). White framing is facing up, silver framing is facing down
  3. Make sure the sheet is properly seated
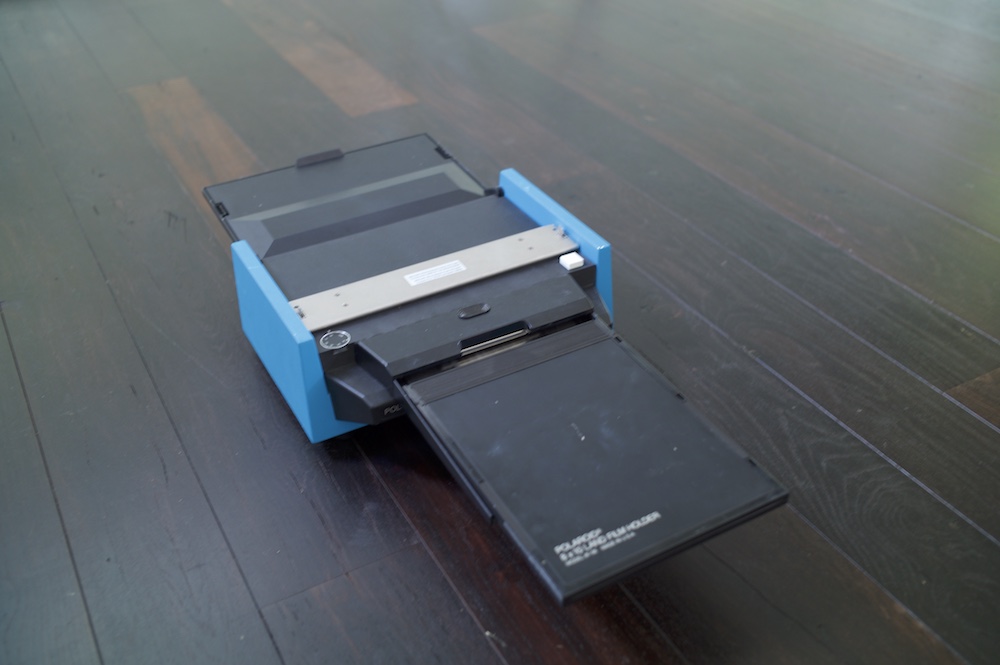
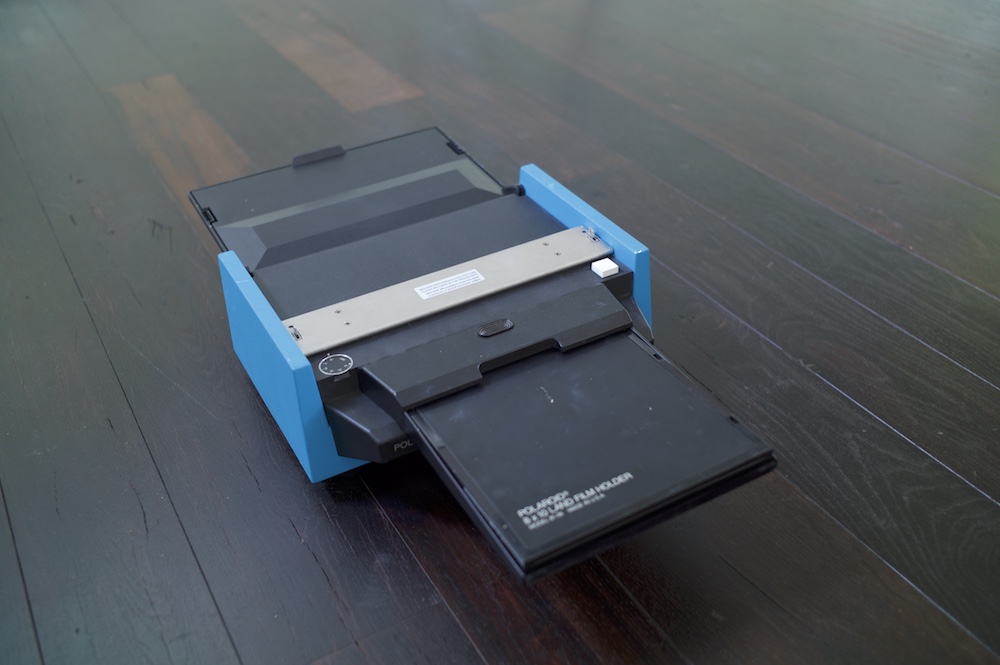
  4. Insert the film holder on top of this, and slide it in, having the “Polaroid 8×10 film holder” text facing up
  5. Make sure the film holder is properly seated
  6. Double check if the rollers are properly clean and locked in place
  7. Make sure the tray where the combined positive & negative sheet end up is closed
  8. Press the white button 
  9. Wait 15 minutes for the film to develop
  10. You now have a Polaroid 8×10 image


Small review on the 75mm f1.25 7Artisans lens in Leica M mount

This is the second 7artisans lens I own now, the first one I own is the 35mm F2 in M mount.

I was surprised by that 35mm lens, and my intent is now to own all of their M mount lenses, since I can interchange them between both my Leica M6 & my Sony A7 mk1.

I received my copy of the lens on the 16th of August, which i consider pretty quick shipping/customs, as I bought it directly in 7Artisans eBay shop a week earlier (the day it became available).

Now since this is my first ever piece of text i write about a lens, don’t expect this to be the best review ever about a lens 🙂

First up, opening up the package.

The lens came well packed, the style of the box is different from their previous ones, I quite like it.

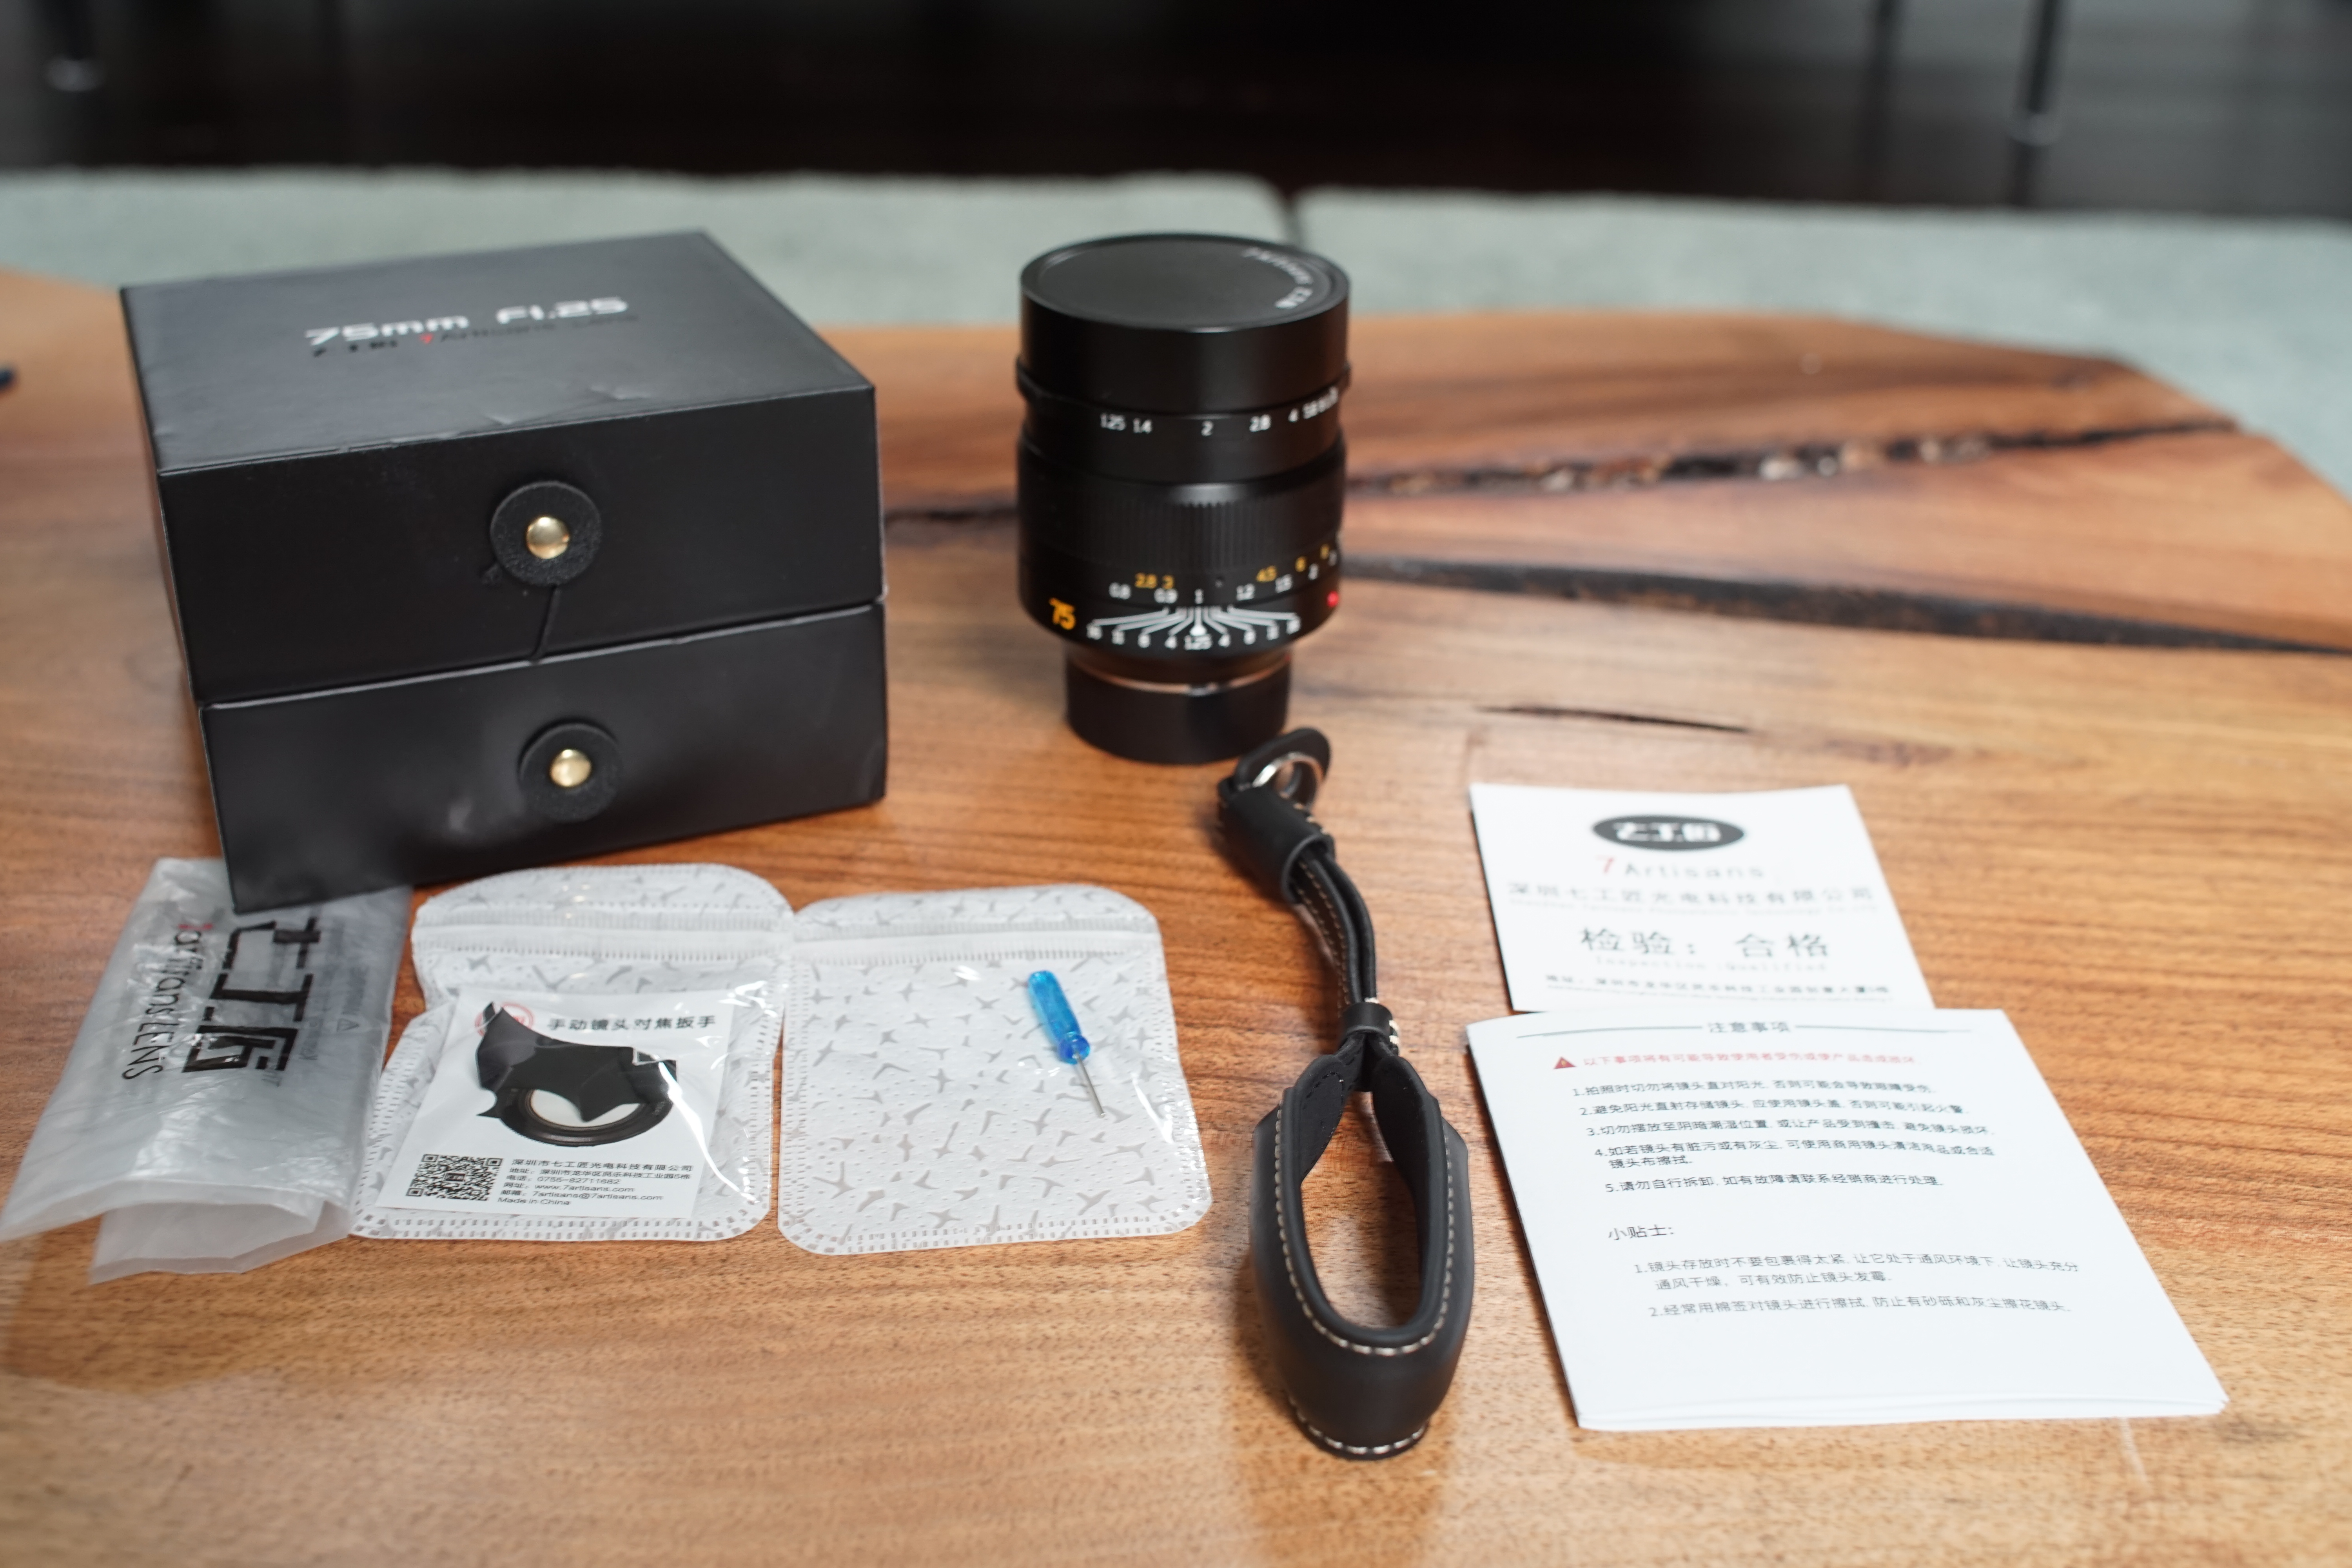
Contents of the package:

  • lens
  • manual
  • adjustment tool
  • focus tab (to be mounted seperately)
  • wrist strip for your camera
  • soft bag (forgot to include in the picture)
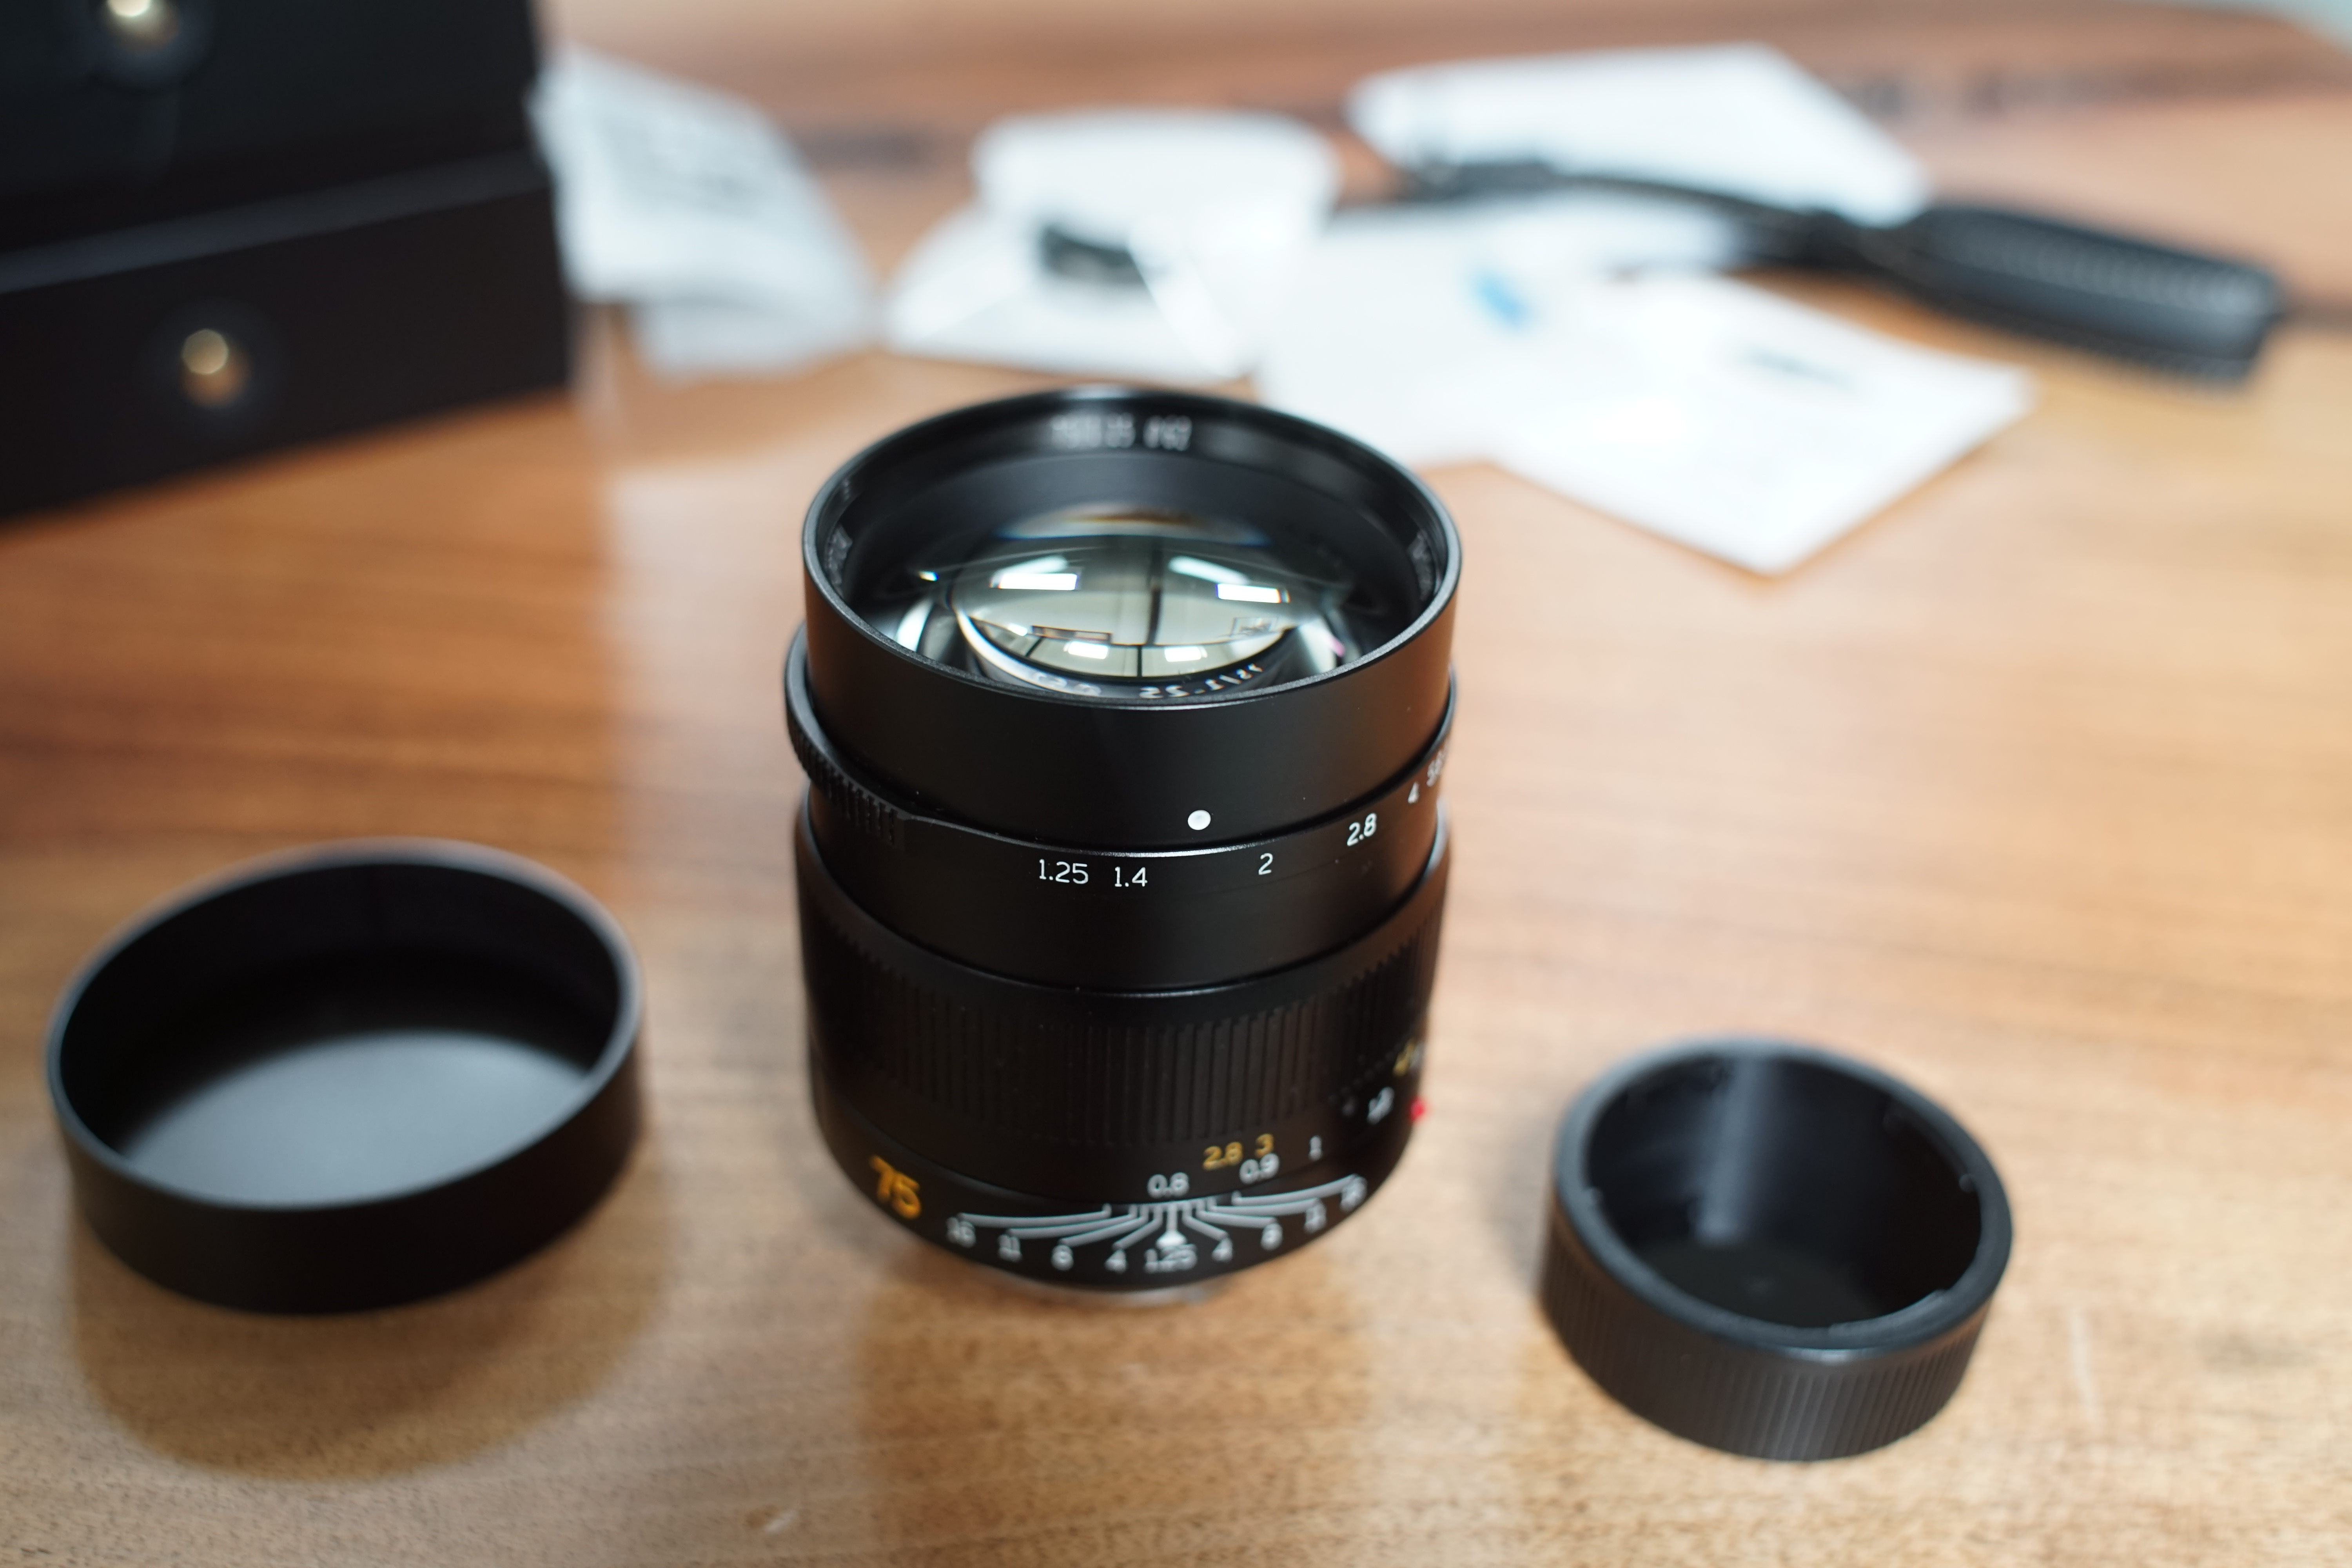
7Artisans 75mm f1.25 M mount

What I am wondering is if the lens is pre-calibrated for Leica M rangefinder cameras. My previous 35mm came with a calibration chart. This one doesn’t. I guess I will quickly find out after running a roll of film through it.

Build Quality

Removed the lens from it’s plastic, and turned some aperture and focus rings. Everything feels very solid. There is no lateral movement on both aperture & focus rings. All the protection caps sit really snug on the lens. The front cap has some felt in it. Aperture rings feels smooth rotating it. The focus ring makes a bit of a grinding noise when you’re near infinity, well grinding is a big word, but you can hear it’s not as smooth as when in the close focus area of the ring movement. EDIT: This has now completely disappeared after using the lens for a an hour of 2.

Image quality

Mounted the lens on my Sony A7, and took a few shots. Unfortunately the whole day here in the Netherlands has been overcast, so no nice light in the evening.

All shots are at f1.25 because why else would you get this lens :).
None of the shots have been processed, straight of the camera, and if you do right-click/view image, you will get the actual 6000*4000 resolution picture. EXIF information will show iso & shutter speed.

I took some inside shots, outside shots and a test range going through all apertures to check the following:

  • differences in aperture for bokeh/sharpness
  • see vignetting
  • if there’s any purple fringing going on

Then in the evening, i took some shots on ISO 640.

Inside shots

I’ll just let the images speak for themselves, all shot @ f1.25

Outside shots

I’ll just let the images speak for themselves, all shot @ f1.25

f1.25 @ iso 100

f1.25 @ iso 100

Aperture range f1.25 – f16

f1.25 @ iso 100

f1.4 @ iso 100

f2 @ iso 100

f2.8 @ iso 100

f4 @ iso 100

f5.6 @ iso 100

f8 @ iso 100

f11 @ iso 100

f16 @ iso 100

My takeaways from taking this lens through it’s apertures:

  • Colours are warm at f1.25 & f1.4, f2 and up they are suddenly cooler
  • Vignetting not that much, and almost completely gone at f2.8
  • purple & green fringing goes away in non focused areas at around f4
  • bokeh sometimes a bit busy at f1.25 , but generally good
  • sharpness off center seems pretty good to me
  • I like this lens

Evening shots

These shots are taken at ISO 640

f1.25 @ iso 640

f1.25 @ iso 640

Conclusion

Now, since I’m not an official lens reviewer, and just thought that it would be nice to write something about this lens, my conclusion is just some ramblings about other lenses and price comparisons.

I like this lens, it’s about 1/23rd of the price of the Leica f1.25 lens, which is probably with regards to image quality in a different stratosphere/insanely better, but for this price, I’m happy I bought the lens. Even though i have never played with that lens, and probably never will.

I’ve also not ever played with the voigtlander 75 f1.5 that just came out, which is about double the price. I’ll let the know lens reviewers on the web take a conclusion on which one is better. I just hope that lens is twice as good as this 🙂

How to configure 1 minute polling on Observium

1 Minute polling for Observium, quite an interesting and useful feature if you ask me. Especially with large capacity interfaces such as 25/40/100gbit interfaces, there’s tiny differences which could be interesting to spot, and you just can’t see those when you are using 5 minute polling. Another interesting used case for example are your uplinks, and your core links in your network.
By default Observium is not setup to do this, and it requires a couple of changes. Now luckily, it’s not that hard to change this, as the configuration settings for the RRDs are a bit hidden, but setup in such a way, that you can actually change this.

First before we get into the details on how to actually do this there are a couple of things you’ll need/want to know:

N E E D   T O    K N O W :

  • These changes are an all or nothing setup. Meaning, all your things will be polled on a 1 minute interval, that is sensors, ports, cpu’s, memory, everything. No possibility to do just a couple of things on 1 minute intervals
  • You NEED to do this with an empty RRD directory / new installation, as RRD files need to be recreated with the proper ‘time brackets’ configured in them
  • I have not tested it on an existing installation, so i don’t know what will happen, you could probably loose your data, or at least corrupt it. I simply don’t know enough of RRDtool what will happen.
  • Make sure all your devices finish their polling within 1 minute
  • It’s NOT, and i repeat NOT an officially supported thing. Observium (Adam Armstrong) recommends against it
  • There will be a 5time increase in load on your server
  • Your disk IO will increase by 5 times as well. Keep that in mind if your are for example runnning your RRD directory on an SSD, as this will wear out 5 times as fast

Configuration
Ok, let’s see how to configure this:

In the default configuration thats deployed once you have downloaded it, the RRD settings are configured for:

  • 7 days of 5 minutes
  • 62 days of 30 minutes
  • 120 days of 2 hours
  • 4 years of 1 day

Now these settings are perfectly acceptable for me, except the first one ofcourse. We’ll want that to change to 1 minute.

You’ll need to make changes in 2 places:

  • Observium configuration file
  • Crontab

Your configuration is stored in, and you can lookup them up in the file /opt/observium/includes/defaults.inc.php

It looks like this:


// Default Poller Interval (in seconds)
$config['rrd']['step'] = 300;
// 7 days of 5 min 62 days of 30 min 120 days of 2 hour 4 years of 1 day
$config['rrd']['rra'] = "RRA:AVERAGE:0.5:1:2016 RRA:AVERAGE:0.5:6:2976 RRA:AVERAGE:0.5:24:1440 RRA:AVERAGE:0.5:288:1440 ";
$config['rrd']['rra'] .= " RRA:MIN:0.5:6:1440 RRA:MIN:0.5:96:360 RRA:MIN:0.5:288:1440 ";
$config['rrd']['rra'] .= " RRA:MAX:0.5:6:1440 RRA:MAX:0.5:96:360 RRA:MAX:0.5:288:1440 ";

Now you could modify the RRD settings in this file, but that’s not really helping if the default settings get adjusted when you upgrade your Observium instance. So change it in the file /opt/observium/config.php

Change 2 things in that piece of text:

  • the rrd step size from 300 to 60
  • the first RRA value from RRA:AVERAGE:0.5:1:2016 to RRA:AVERAGE:0.5:1:10080

Once this has been changed, change your cronjob (/etc/cron.d/observium) to run poller-wrapper / poller every minute

That should be it! Enjoy your 1 minute resolution in Observium!

Observium SYSLOG alerting

Observium SYSLOG alerting

I maintain an updated version on Github: https://github.com/mgmoerman/docs/blob/master/observium-syslog-alerting.md

Observium has builtin syslog alerting since release r7970. This text will explain on what it does, how it works, and how you configure it.

Something that was missing in the entity based alerting system, is now fixed with this brand new feature of Observium.

You can now perform realtime alerting where as the conventional entity based alerting only would trigger every 5 minutes, because it is poller based.

Now this new feature is not going to replace the existing entity alerting, as it just serves a different purpose, as it just allows you to catch issues from your devices, which are not possible to catch with the existing entity based alerting system. Examples are: Duplicate IPs/MAC addresses, or OSPF messages.

Syslog alerting allows you to send out notifications from syslog messages that are produced by your devices. You can match on those with Regular Expressions

Syslog alerting in observium perfectly integrates with the existing contact system, so it allows you to notify via the usual channels, E-mail, Slack, Pagerduty, XMPP, webhook, etc.

For a complete overview of transport methods, see: Alerting Transports

How to set it up

First make sure you have configured syslog to integrate with Observium. The documentation for doing this, can be found here: Syslog Integration

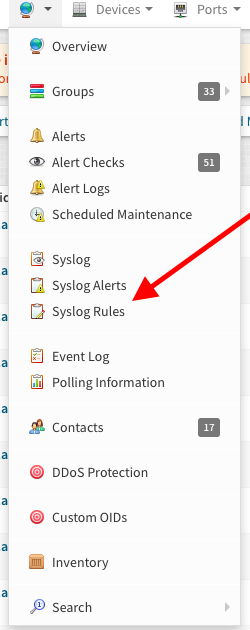
If you are running r7970 or later you will find 2 new entries in the global menu:

  • Syslog Alerts
  • Syslog Rules

screenshot1

Let’s start with creating a useful syslog alert rule, that triggers an alert when there is a duplicate mac address found on a Cisco device:

  • First click on “Syslog Rules” in the global menu
  • Then click on “Add Syslog Rule”

screenshot2

You will then be presented with the following screen, where you have to configure the details of the syslog alert rule:

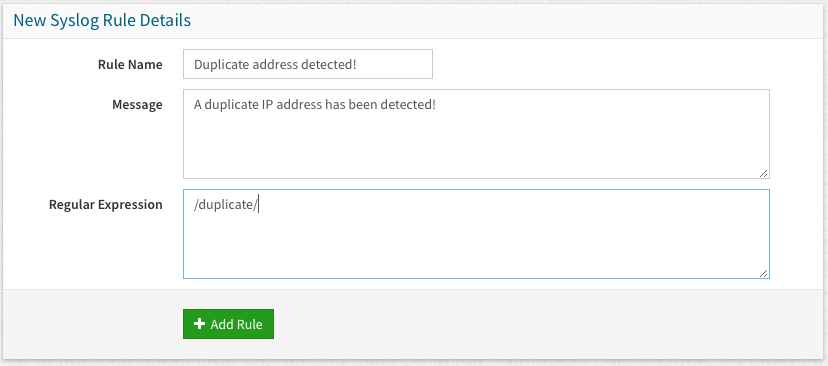
  • Rule Name: This defines the name for the actual rule, this is just an administrative reference
  • Message: This is the message that will end up in the notification send out
  • Regular Expression: This is where you configure the actual rule to match syslog content against

screenshot3

Syslog Rules are built using standard PCRE regular expressions.

There are many online resources to help you learn and test regular expressions. Good resources include regex101.com, Debuggex Cheatsheet, regexr.com and Tutorials Point. There are many other sites with examples which can be found online.

A simple rule to match the word “duplicate” could look like:

/duplicate/

A more complex rule to match SSH authentication failures from PAM for the users root or adama might look like:

/pam.+\(sshd:auth\).+failure.+user\=(root|adama)/

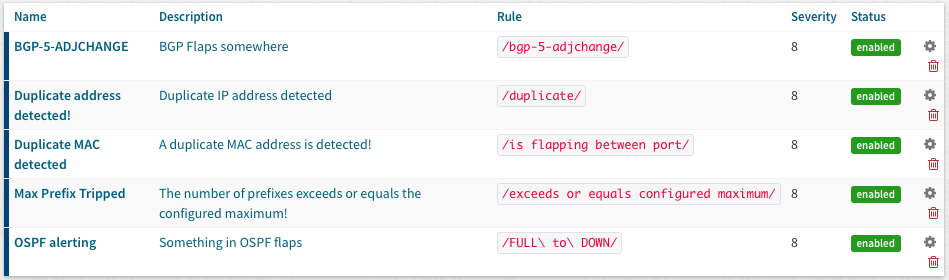
Useful syslog alerts

Here are a couple of alerts you could implement which come in pretty handy:

screenshot4

Sending out notifications

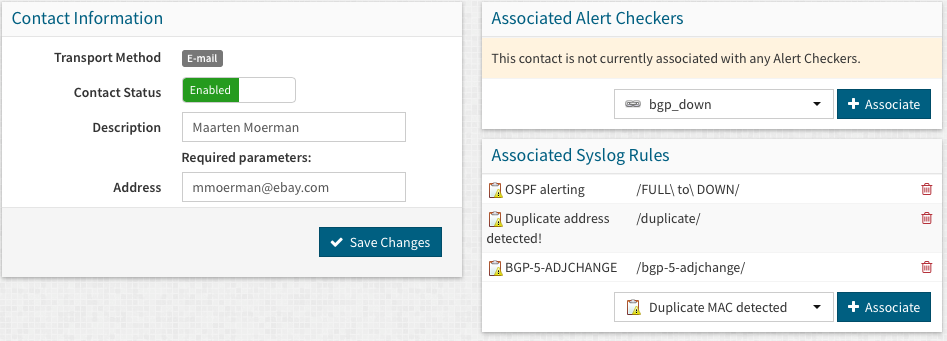
To actually send out notifications, you will have to associate the syslog alert rule with the contact. To do this, edit the contact that you have configured and add the syslog rule association:
screenshot5

Select from the drop down a syslog alert rule, and click “+ Associate”. Once you have done this, the association is completed

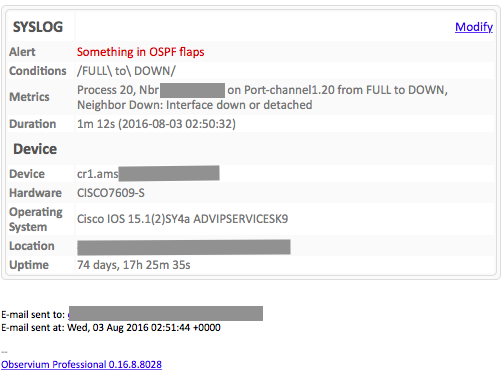
If you associate it to an email contact, the notification will look like this:
screenshot5

Monitor a custom SNMP OID with Observium

Custom SNMP OIDs in Observium, how cool is that! Since release 7175 of Observium Professional, it is now possible to have these custom SNMP OIDs monitored and graphed. This is quite handy, as writing individual device support for devices that are not recognized by Observium itself can be hard for people, as you need to dive into PHP, and Observiums codebase, and the code you might turn out might not be as beautiful as the Observium Dev team likes it to see, so it won’t be merged.

Now some people can perfectly live with a device being added, and shown up as a “Generic Device”, and have all the basic funtionality of the standard MIBS. This works to a certain extend off course. Now what if you just want to add something weird (SNR, RF levels for example) that is not supported by Observium out of the box, wether it be a standard graph, or an entity type that is not supported, this is now possible!

So here is how it works:

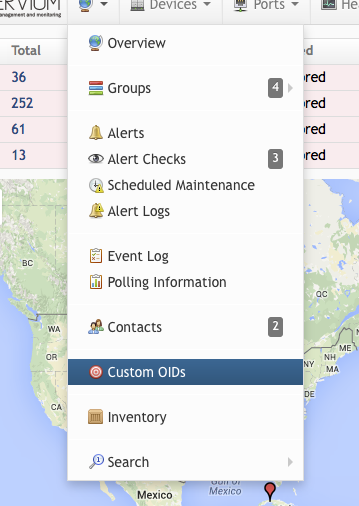
Click on the “Custom OID” menu in the global menu (the one with the globe), and you’ll get an overview of the custom OIDs configured by you.

custom oid menu

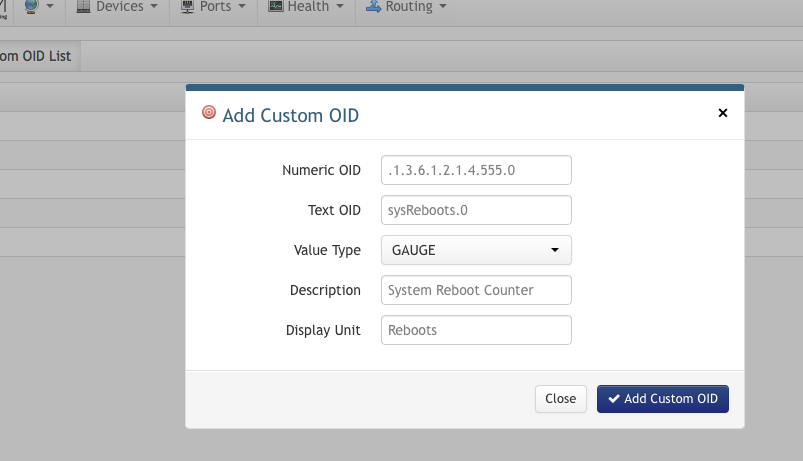
Then click on the “Add Custom OID” option in the right top corner to get the input fields:

custom oid input fields

There’s a couple of fields that you’d have to fill in:

Numeric OID: This is the OID in SNMP that you want to monitor
Text OID: Right now, this doesn’t do much, but it’s advisable to use the MIB translated name for this
Value type: Specific wether the value you are retrieving is a GAUGE or a COUNTER (for information on what this is, i advise you to read the RRD documentation on the differences between the two.
Description: This is what the name of the entry is in the overview
Display Units: This is the text that will be displayed in the legend of the graph that’s being created

After you’re done with filling in these fields, submit it, and you’ll be returned to the overview of custom OIDs. By now, this isn’t doing anything yet.
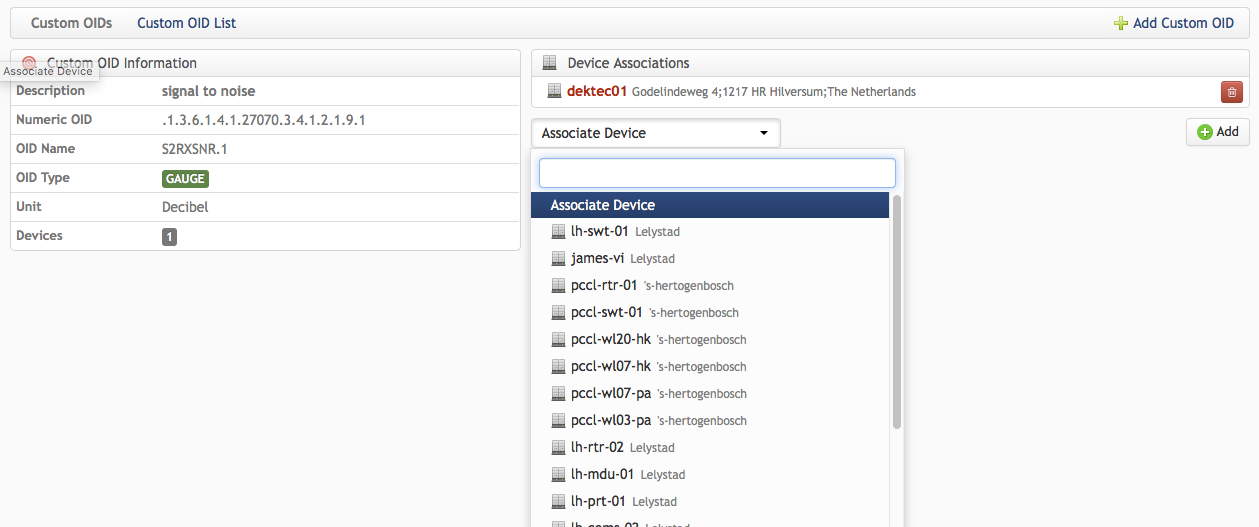
What you have to do is associate the custom OID with a device of your choosing. This association is pretty nifty, as it allows you to only write a custom OID once, and the associate with an unlimited amount of devices:

associate custom oids

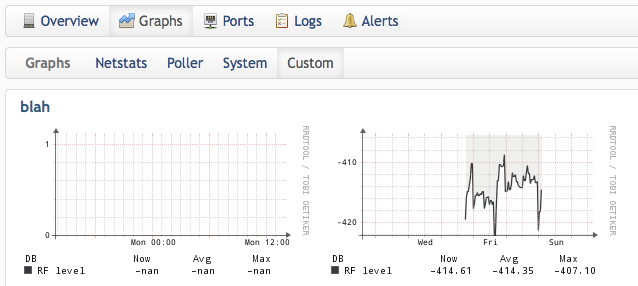
Once this is done, and you have the correct OID being polled, and after 15minutes of polling, you should be able to see graphs in the Custom Graphs part of the device:

graphs

Useful Observium alert checker examples

This page is outdated as of Feb 26 2015, as state sensors have been rewritten. I keep an updated document on:
https://github.com/mgmoerman/docs/blob/master/observium-alert-checkers.md

Observium straight out of the SVN repository (if you bought the subscription) doesn’t come with alert-checkers, which is unfortunate, as you need to figure out how this alerting system works by trial and error. Goal of this blog post is to give some examples of generic alert-checkers, and provide some more explanation on Metrics & Attributes, and some of the values that go with it. This document is off course not complete, and can always be improved. Please give me feedback to improve this.

Observium has a very powerful way of using entity types & check conditions to do alerting. But you do need to know how this is implemented.

There is some documentation on the Observium site itself, which is useful to read:

Creating an alert checker

Let’s go through the steps that are involved to actually create/add an alert checker in Observium

Entity type

First of all when you create an alert,you’ll need to pick the ‘entity’ type for what you are building the alert for. An entity type is nothing more than a “thing” for which you would like to see alerts.

These are the ones that are available as of 12/12/2014:

  • Device
  • Memory
  • Storage
  • Processor
  • BGP Peer
  • Netscaler vServer
  • Netscaler Service
  • Toner
  • Port
  • Sensor

They kinda speak for them selves, if you want alerts on things that go on with ports, pick ports, if you want something that has to do with a sensor, pick that one. Device is a very generic one, and will just give you status things on wether it’s up/down and it’s uptime and the response time for ping/snmp, the entity type Device has nothing to do with Ports or Sensor on the device itself, for alerting for that, pick actually Ports or Sensor

Alert Checker details

Once you picked the entity type, there’s a couple of more things that need to be filled in but these are simple, pick a name for the alert, and pick a message you want to be included once an alert is sent out.

Use Alert Delay to set the amount of poller runs that a condition of your alert checker should persist until it actually starts alerting. This could be useful when for example you’re creating a check for processor usage, but you don’t want to be alerted on every CPU spike that is happening. If you set a delay of say, 2, it’ll take 2 poller runs for actually alerting (providing the condition for which you are checking hasn’t changed off course)

Send Recovery button is self explanatory, and the Severity is currently not in use

Checker Conditions

Then we come to the Checker Conditions, this is where you actually implement the check for a specific entity.

It’s important to know what Metrics & Attributes are, see the overview below for a complete list of Metrics & Attributes

When filling in the fields for Checker Conditions, you use the Metrics mentioned in this page.

These need to be single lined entries, you can put as much in there if you want but you usually have one to check for a single condition, or two, for example to check an upper and lower limit. Use the boolean to switch between ANY or ALL of these conditions to match.

A single line consists of three values:

  • the actual metric
  • a “test” (le, ge, lt, gt, ne, match and notmatch)
  • a value

Associations

In these input fields you’ll create the first association rule, in other words, which subset of the entity type you selected needs alerting based on the conditions specified in the previous pane. When initially creating an alert checker, it allows for ony 1 association rule. Once it’s added, you can later on add more association rules to it.

These association rules are made from a “device association” and an “entity association”. First input field you’ll do your device matching, based on the attributes for devices. Second input field you’ll do your entity matching, using the attributes for the entity type you want to associate it with (this can off course be different then the condition you’re checking for)

This works in sort of the same way as the Checker Conditions. It uses the same line method (metric,test,value), however with some exceptions:

  • instead of using metrics, you’ll be using attributes
  • you can’t use a device attribute twice in the same association rule, so for example multiple “hostname match bla” statements with in the same association rule won’t work
  • for a single device association line, you can have multiple entity association lines

That last exception allows for more specific filtering, for example, you would want to match against all sensor classes (sensor_class) that are of type “state”, but when that nets you to many results, you can add a match for it’s description (sensor_descr), or you’d want to match all ports of type (ifType) ethernetCsmacd, but you only want certain ones with a specific description (ifAlias)

Example alerts

If you scrolled down here to just copy/paste some alert-checkers, perfectly fine, but don’t complain if they don’t work, PLEASE read how these work above.

The following is a set of very useful alert checkers:

Alert Entity type Check Conditions Check Conditions boolean Device match Entity match
Device down Device device_status equals 0 ANY * *
Processor usage is above 80% Processor processor_usage greater 80 ALL * processor_descr match processor
Memory usage is above 70% Memory mempool_perc greater 70 ALL * *
State sensor is in ALERT state! Sensor sensor_event equals alert ANY * sensor_class equals state
Fanspeed is above or under treshold Sensor sensor_value greater @sensor_limit
sensor_value less @sensor_limit_low
ANY * sensor_class equals fanspeed
Temperature is higher then 50 degrees Sensor sensor_value gt 50 ANY * sensor_class equals temperature
Traffic exceeds 85% Port ifInOctets_perc ge 85
ifOutOctets_perc ge 85
ANY * ifType equals ethernetCsmacd
BGP Session down BGP Peer bgpPeerState notequals established ANY * bgpPeerRemoteAs equals 41552
Storage exceeds 85% of disk capacity Storage storage_perc ge 85 ANY * storage_type equals hrStorageFixedDisk
Port has encountered errors or discards Port ifInErrors_rate gt 1
ifOutErrors_rate gt 1
ANY * ifType equals ethernetCsmacd
Port is enabled, but operationally down Port ifAdminStatus equals up
ifOperStatus notequals up
ALL * ifType equals ethernetCsmacd

Per entity overview of Attributes , Metrics and their values (if any)

Device

Metrics Values
device_status 0 = down, 1 = up
device_status_type reason for down, ‘snmp’/’ping’
device_ping response in ms
device_snmp response in ms
device_uptime in seconds
device_duration_poll in seconds
Attributes Values
hostname Self explanatory, this is the hostname for the device
os  cisco,asa,junos,linux,printer, generic, etc.
For an up-to-date list see /opt/observium/includes/definitions/os.inc.php
type network,server,workstation,storage,voip,firewall
sysName Derived through SNMP
sysDescr Derived through SNMP
sysContact Derived through SNMP
hardware Derived through SNMP
serial Derived through SNMP

Port

Metrics Values
ifInOctets_rate & ifOutOctets_rate number
ifInOctets_perc & ifOutOctets_perc 0-100 percentage
ifInUcastPkts_rate & ifOutUcastPkts_rate number
ifInErrors_rate & ifOutErrors_rate number
rx_ave_pktsize & tx_ave_pktsize
ifOperStatus up/down
ifAdminStatus up/down
ifSpeed interface speed derived through SNMP in mbit
ifMtu number
ifDuplex full/half
Attributes Values
ifSpeed interface speed in a mbit number
ifAlias the interface description
ifDescr Location of the interface, (blade, slot, etc)
ifName
ifType name of interface as described by IANA, see https://www.iana.org/assignments/ianaiftype-mib/ianaiftype-mib
ifPhyAddress MAC address of the interface
port_descr_type
port_descr_descr
port_descr_speed
port_descr_circuit
port_descr_notes

Memory

Metrics Values
mempool_free
mempool_perc 0-100 percentage
mempool_used
Attributes Values
mempool_descr
mempool_mib
mempool_index

Processor

Metrics Values
processor_usage 0-100 percentage
Attributes Values
processor_descr
processor_type
processor_oid

Storage

Metrics Values
storage_free
storage_perc 0-100 percentage
storage_used
Attributes Values
storage_descr
storage_type
storage_mib
storage_index

BGP Peer

Metrics Values
bgpPeerState established
bgpPeerAdminStatus
bgpPeerFsmEstablishedTime
Attributes Values
as_text
bgpPeerRemoteAs
bgpPeerRemoteAddr
bgpPeerLocalAddr
bgpPeerIdentifier

Sensor

Metrics Values
sensor_value number
sensor_event up, warning, alert, down
Attributes Values
sensor_descr
sensor_class voltage, current, power, frequency, humidity, fanspeed, temperature, dbm, state
sensor_type
sensor_index
poller_type possible types: snmp, agent, ipmi

Toner

Metrics Values
toner_current
Attributes Values
toner_descr

Netscaler vServers

Metrics Values
vsvr_state
vsvr_bps_in
vsvr_bps_out
Attributes Values
vsvr_name this matches vsvr_fullname except when longer then 32chars, it becomes a randomstring
vsvr_fullname
vsvr_label
vsvr_ip
vsvr_ipv6
vsvr_port
vsvr_type
vsvr_entitytype

Netscaler Services

Metrics Values
svc_state
svc_bps_in
svc_bps_out
Attributes Values
svc_name this matches vsvr_fullname except when longer then 32chars, it becomes a randomstring
svc_fullname
svc_label
svc_ip
svc_port
svc_type

Building a buck for a Porsche Typ64

So, lately i’ve been playing with the idea of doing something with the english wheel in aluminium, so I came up with something nice.

Why wouldn’t I try to build a replica of a Porsche Typ64, it can be build on a vw beetle chassis, as it has the same wheelbase, and vw beetle parts are cheap.

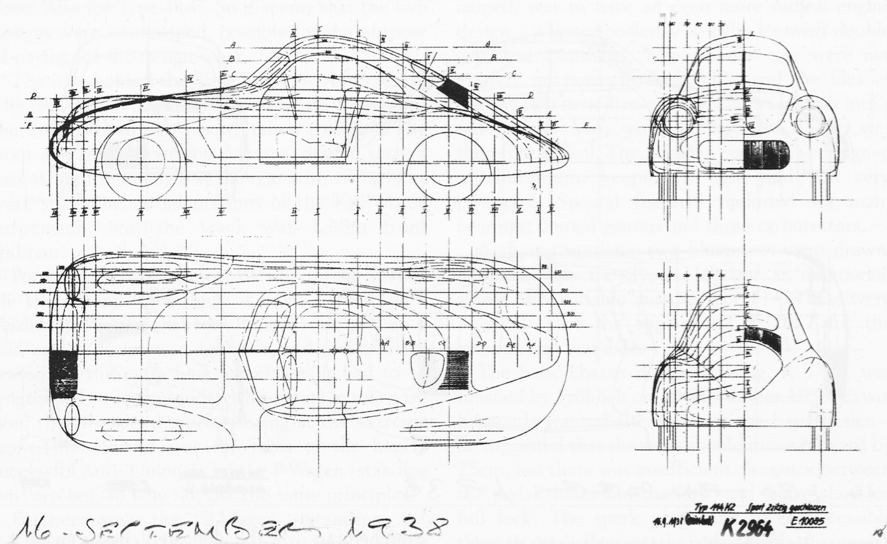
The only thing that would make it somewhat expensive is the building of a proper buck. Anyway, i just started with a drawing found on the internet, which had an OK’ish resolution for doing some measurements, and drawing it in CAD.
This is the drawing (small resolution):

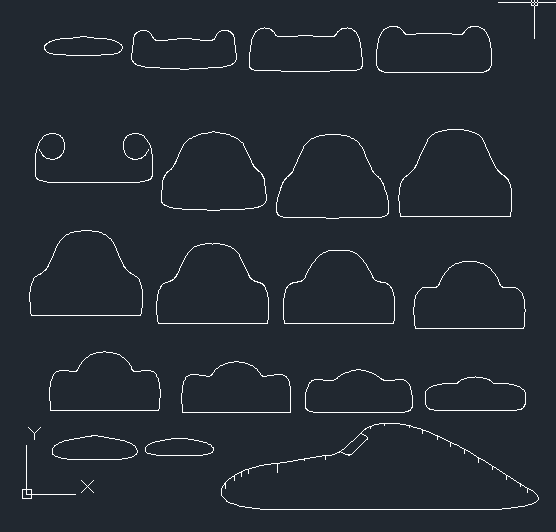
So after doing a couple of hours of CAD, I came up with this:

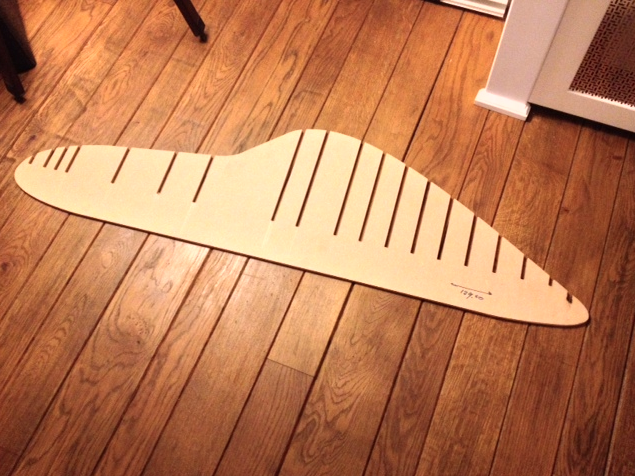
Which led to this (thanks to CNCfrees.nl):

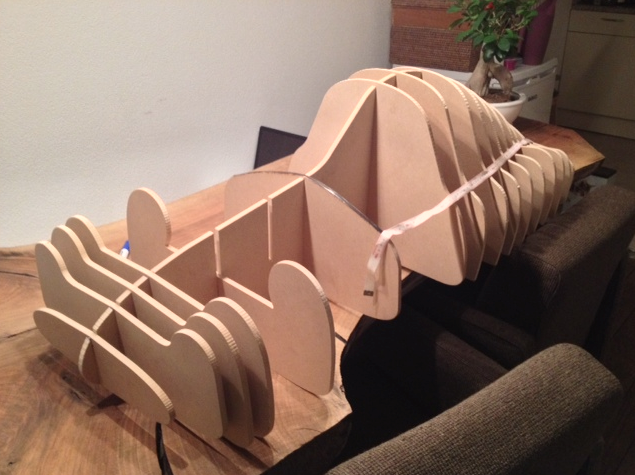
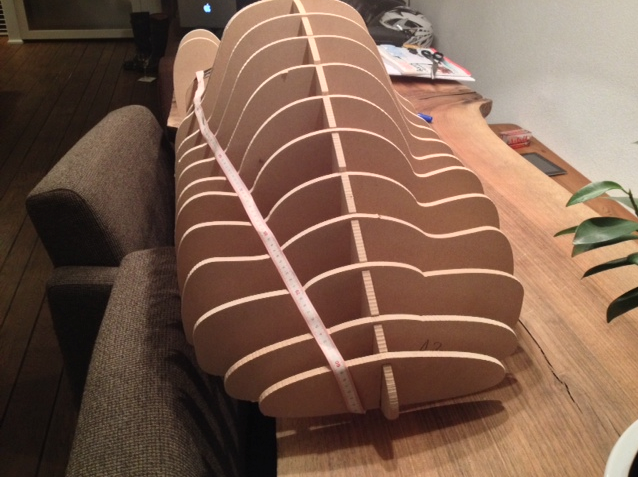
Now, all of that put together gave me this:


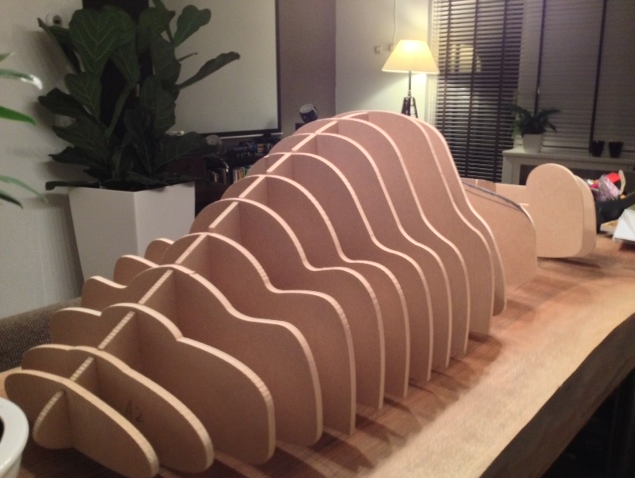
Now this is a scaled down version which I had CNC’ed out of MDF. This is to check measurements, and see if I’m on the right track, as the front of the car is somewhat vague, cause I can’t get the right buck details out of the technical drawing, so I need to sharpen my CAD skills a bit.

Anyway, I post more updates when I have them. I’ll start making the scaled down version first, and once that is done, I’ll start having the buck CNC’ed on a 1:1 scale.

The idea is that it ends up something like this: