This page is outdated as of Feb 26 2015, as state sensors have been rewritten. I keep an updated document on:
https://github.com/mgmoerman/docs/blob/master/observium-alert-checkers.md
Observium straight out of the SVN repository (if you bought the subscription) doesn’t come with alert-checkers, which is unfortunate, as you need to figure out how this alerting system works by trial and error. Goal of this blog post is to give some examples of generic alert-checkers, and provide some more explanation on Metrics & Attributes, and some of the values that go with it. This document is off course not complete, and can always be improved. Please give me feedback to improve this.
Observium has a very powerful way of using entity types & check conditions to do alerting. But you do need to know how this is implemented.
There is some documentation on the Observium site itself, which is useful to read:
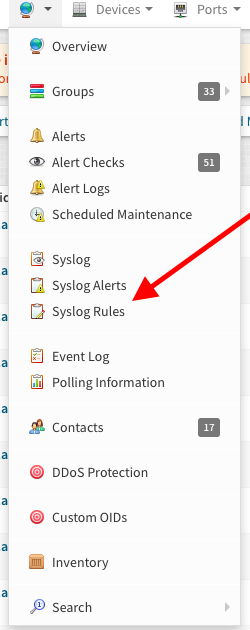
Creating an alert checker
Let’s go through the steps that are involved to actually create/add an alert checker in Observium
Entity type
First of all when you create an alert,you’ll need to pick the ‘entity’ type for what you are building the alert for. An entity type is nothing more than a “thing” for which you would like to see alerts.
These are the ones that are available as of 12/12/2014:
- Device
- Memory
- Storage
- Processor
- BGP Peer
- Netscaler vServer
- Netscaler Service
- Toner
- Port
- Sensor
They kinda speak for them selves, if you want alerts on things that go on with ports, pick ports, if you want something that has to do with a sensor, pick that one. Device is a very generic one, and will just give you status things on wether it’s up/down and it’s uptime and the response time for ping/snmp, the entity type Device has nothing to do with Ports or Sensor on the device itself, for alerting for that, pick actually Ports or Sensor
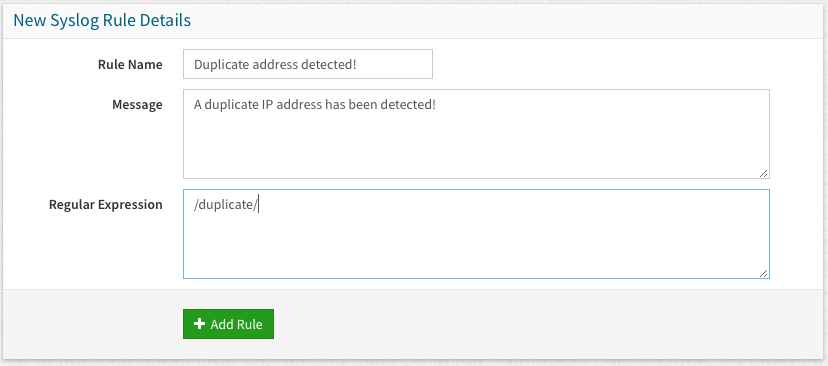
Alert Checker details
Once you picked the entity type, there’s a couple of more things that need to be filled in but these are simple, pick a name for the alert, and pick a message you want to be included once an alert is sent out.
Use Alert Delay to set the amount of poller runs that a condition of your alert checker should persist until it actually starts alerting. This could be useful when for example you’re creating a check for processor usage, but you don’t want to be alerted on every CPU spike that is happening. If you set a delay of say, 2, it’ll take 2 poller runs for actually alerting (providing the condition for which you are checking hasn’t changed off course)
Send Recovery button is self explanatory, and the Severity is currently not in use
Checker Conditions
Then we come to the Checker Conditions, this is where you actually implement the check for a specific entity.
It’s important to know what Metrics & Attributes are, see the overview below for a complete list of Metrics & Attributes
When filling in the fields for Checker Conditions, you use the Metrics mentioned in this page.
These need to be single lined entries, you can put as much in there if you want but you usually have one to check for a single condition, or two, for example to check an upper and lower limit. Use the boolean to switch between ANY or ALL of these conditions to match.
A single line consists of three values:
- the actual metric
- a “test” (le, ge, lt, gt, ne, match and notmatch)
- a value
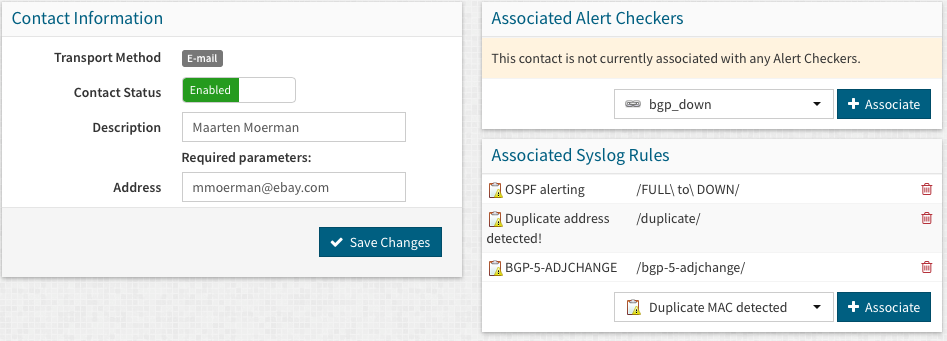
Associations
In these input fields you’ll create the first association rule, in other words, which subset of the entity type you selected needs alerting based on the conditions specified in the previous pane. When initially creating an alert checker, it allows for ony 1 association rule. Once it’s added, you can later on add more association rules to it.
These association rules are made from a “device association” and an “entity association”. First input field you’ll do your device matching, based on the attributes for devices. Second input field you’ll do your entity matching, using the attributes for the entity type you want to associate it with (this can off course be different then the condition you’re checking for)
This works in sort of the same way as the Checker Conditions. It uses the same line method (metric,test,value), however with some exceptions:
- instead of using metrics, you’ll be using attributes
- you can’t use a device attribute twice in the same association rule, so for example multiple “hostname match bla” statements with in the same association rule won’t work
- for a single device association line, you can have multiple entity association lines
That last exception allows for more specific filtering, for example, you would want to match against all sensor classes (sensor_class) that are of type “state”, but when that nets you to many results, you can add a match for it’s description (sensor_descr), or you’d want to match all ports of type (ifType) ethernetCsmacd, but you only want certain ones with a specific description (ifAlias)
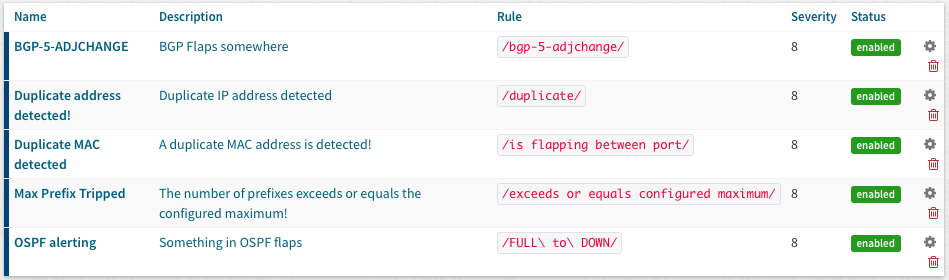
Example alerts
If you scrolled down here to just copy/paste some alert-checkers, perfectly fine, but don’t complain if they don’t work, PLEASE read how these work above.
The following is a set of very useful alert checkers:
| Alert |
Entity type |
Check Conditions |
Check Conditions boolean |
Device match |
Entity match |
| Device down |
Device |
device_status equals 0 |
ANY |
* |
* |
| Processor usage is above 80% |
Processor |
processor_usage greater 80 |
ALL |
* |
processor_descr match processor |
| Memory usage is above 70% |
Memory |
mempool_perc greater 70 |
ALL |
* |
* |
| State sensor is in ALERT state! |
Sensor |
sensor_event equals alert |
ANY |
* |
sensor_class equals state |
| Fanspeed is above or under treshold |
Sensor |
sensor_value greater @sensor_limit
sensor_value less @sensor_limit_low |
ANY |
* |
sensor_class equals fanspeed |
| Temperature is higher then 50 degrees |
Sensor |
sensor_value gt 50 |
ANY |
* |
sensor_class equals temperature |
| Traffic exceeds 85% |
Port |
ifInOctets_perc ge 85
ifOutOctets_perc ge 85 |
ANY |
* |
ifType equals ethernetCsmacd |
| BGP Session down |
BGP Peer |
bgpPeerState notequals established |
ANY |
* |
bgpPeerRemoteAs equals 41552 |
| Storage exceeds 85% of disk capacity |
Storage |
storage_perc ge 85 |
ANY |
* |
storage_type equals hrStorageFixedDisk |
| Port has encountered errors or discards |
Port |
ifInErrors_rate gt 1
ifOutErrors_rate gt 1 |
ANY |
* |
ifType equals ethernetCsmacd |
| Port is enabled, but operationally down |
Port |
ifAdminStatus equals up
ifOperStatus notequals up |
ALL |
* |
ifType equals ethernetCsmacd |
Per entity overview of Attributes , Metrics and their values (if any)
Device
| Metrics |
Values |
| device_status |
0 = down, 1 = up |
| device_status_type |
reason for down, ‘snmp’/’ping’ |
| device_ping |
response in ms |
| device_snmp |
response in ms |
| device_uptime |
in seconds |
| device_duration_poll |
in seconds |
| Attributes |
Values |
| hostname |
Self explanatory, this is the hostname for the device |
| os |
cisco,asa,junos,linux,printer, generic, etc.
For an up-to-date list see /opt/observium/includes/definitions/os.inc.php |
| type |
network,server,workstation,storage,voip,firewall |
| sysName |
Derived through SNMP |
| sysDescr |
Derived through SNMP |
| sysContact |
Derived through SNMP |
| hardware |
Derived through SNMP |
| serial |
Derived through SNMP |
Port
| Metrics |
Values |
| ifInOctets_rate & ifOutOctets_rate |
number |
| ifInOctets_perc & ifOutOctets_perc |
0-100 percentage |
| ifInUcastPkts_rate & ifOutUcastPkts_rate |
number |
| ifInErrors_rate & ifOutErrors_rate |
number |
| rx_ave_pktsize & tx_ave_pktsize |
|
| ifOperStatus |
up/down |
| ifAdminStatus |
up/down |
| ifSpeed |
interface speed derived through SNMP in mbit |
| ifMtu |
number |
| ifDuplex |
full/half |
| Attributes |
Values |
| ifSpeed |
interface speed in a mbit number |
| ifAlias |
the interface description |
| ifDescr |
Location of the interface, (blade, slot, etc) |
| ifName |
|
| ifType |
name of interface as described by IANA, see https://www.iana.org/assignments/ianaiftype-mib/ianaiftype-mib |
| ifPhyAddress |
MAC address of the interface |
| port_descr_type |
|
| port_descr_descr |
|
| port_descr_speed |
|
| port_descr_circuit |
|
| port_descr_notes |
|
Memory
| Metrics |
Values |
| mempool_free |
|
| mempool_perc |
0-100 percentage |
| mempool_used |
|
| Attributes |
Values |
| mempool_descr |
|
| mempool_mib |
|
| mempool_index |
|
Processor
| Metrics |
Values |
| processor_usage |
0-100 percentage |
| Attributes |
Values |
| processor_descr |
|
| processor_type |
|
| processor_oid |
|
Storage
| Metrics |
Values |
| storage_free |
|
| storage_perc |
0-100 percentage |
| storage_used |
|
| Attributes |
Values |
| storage_descr |
|
| storage_type |
|
| storage_mib |
|
| storage_index |
|
BGP Peer
| Metrics |
Values |
| bgpPeerState |
established |
| bgpPeerAdminStatus |
|
| bgpPeerFsmEstablishedTime |
|
| Attributes |
Values |
| as_text |
|
| bgpPeerRemoteAs |
|
| bgpPeerRemoteAddr |
|
| bgpPeerLocalAddr |
|
| bgpPeerIdentifier |
|
Sensor
| Metrics |
Values |
| sensor_value |
number |
| sensor_event |
up, warning, alert, down |
| Attributes |
Values |
| sensor_descr |
|
| sensor_class |
voltage, current, power, frequency, humidity, fanspeed, temperature, dbm, state |
| sensor_type |
|
| sensor_index |
|
| poller_type |
possible types: snmp, agent, ipmi |
Toner
| Metrics |
Values |
| toner_current |
|
| Attributes |
Values |
| toner_descr |
|
Netscaler vServers
| Metrics |
Values |
| vsvr_state |
|
| vsvr_bps_in |
|
| vsvr_bps_out |
|
| Attributes |
Values |
| vsvr_name |
this matches vsvr_fullname except when longer then 32chars, it becomes a randomstring |
| vsvr_fullname |
|
| vsvr_label |
|
| vsvr_ip |
|
| vsvr_ipv6 |
|
| vsvr_port |
|
| vsvr_type |
|
| vsvr_entitytype |
|
Netscaler Services
| Metrics |
Values |
| svc_state |
|
| svc_bps_in |
|
| svc_bps_out |
|
| Attributes |
Values |
| svc_name |
this matches vsvr_fullname except when longer then 32chars, it becomes a randomstring |
| svc_fullname |
|
| svc_label |
|
| svc_ip |
|
| svc_port |
|
| svc_type |
|