Custom SNMP OIDs in Observium, how cool is that! Since release 7175 of Observium Professional, it is now possible to have these custom SNMP OIDs monitored and graphed. This is quite handy, as writing individual device support for devices that are not recognized by Observium itself can be hard for people, as you need to dive into PHP, and Observiums codebase, and the code you might turn out might not be as beautiful as the Observium Dev team likes it to see, so it won’t be merged.
Now some people can perfectly live with a device being added, and shown up as a “Generic Device”, and have all the basic funtionality of the standard MIBS. This works to a certain extend off course. Now what if you just want to add something weird (SNR, RF levels for example) that is not supported by Observium out of the box, wether it be a standard graph, or an entity type that is not supported, this is now possible!
So here is how it works:
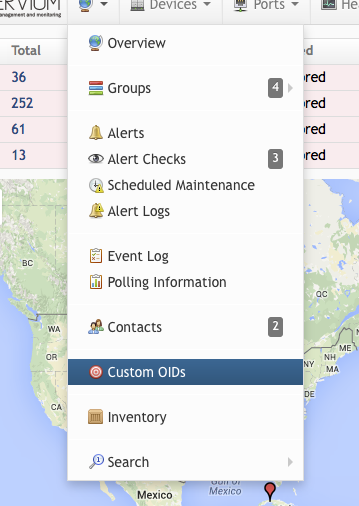
Click on the “Custom OID” menu in the global menu (the one with the globe), and you’ll get an overview of the custom OIDs configured by you.

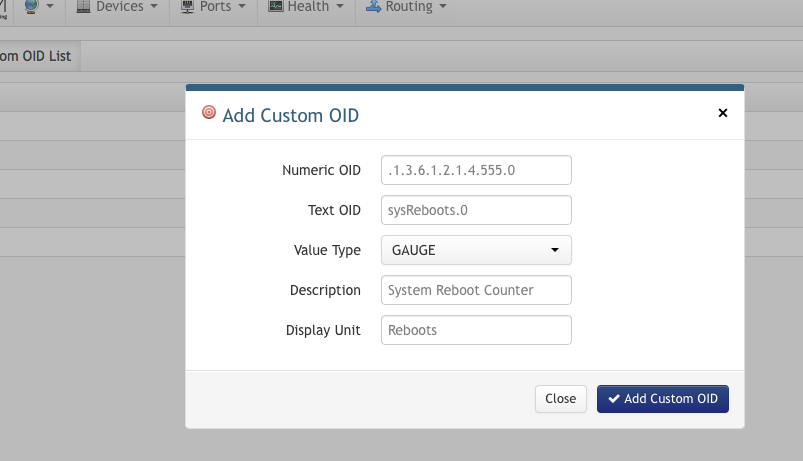
Then click on the “Add Custom OID” option in the right top corner to get the input fields:

There’s a couple of fields that you’d have to fill in:
– Numeric OID: This is the OID in SNMP that you want to monitor
– Text OID: Right now, this doesn’t do much, but it’s advisable to use the MIB translated name for this
– Value type: Specific wether the value you are retrieving is a GAUGE or a COUNTER (for information on what this is, i advise you to read the RRD documentation on the differences between the two.
– Description: This is what the name of the entry is in the overview
– Display Units: This is the text that will be displayed in the legend of the graph that’s being created
After you’re done with filling in these fields, submit it, and you’ll be returned to the overview of custom OIDs. By now, this isn’t doing anything yet.
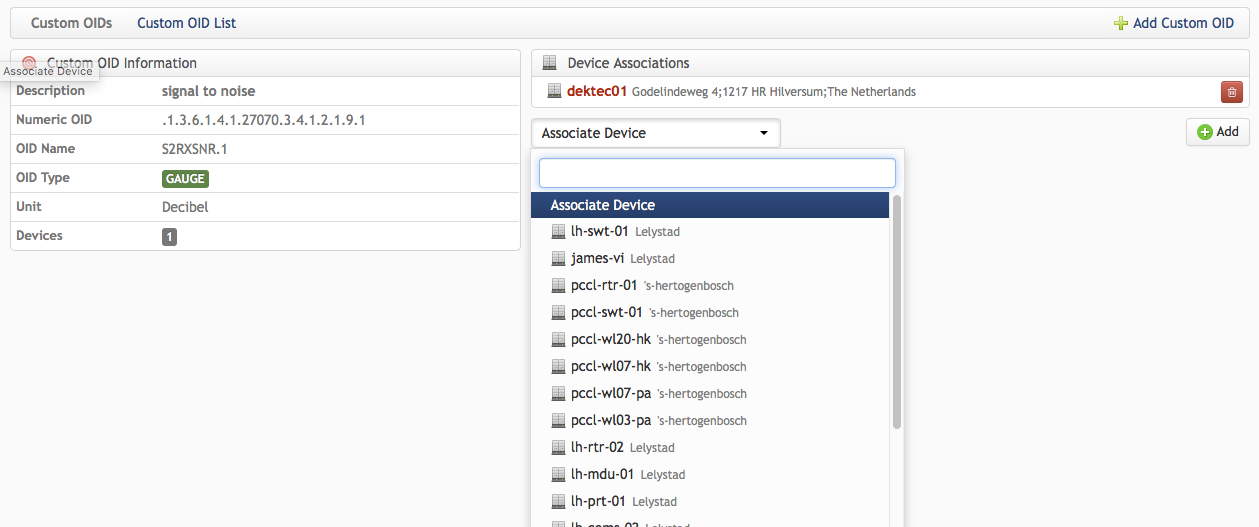
What you have to do is associate the custom OID with a device of your choosing. This association is pretty nifty, as it allows you to only write a custom OID once, and the associate with an unlimited amount of devices:

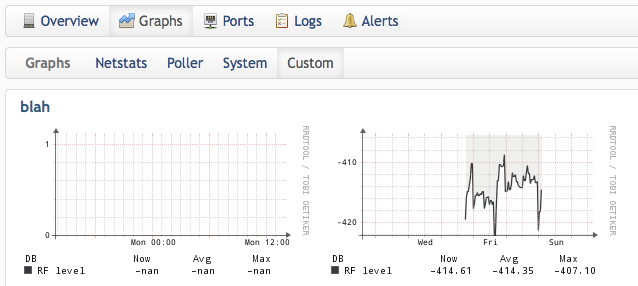
Once this is done, and you have the correct OID being polled, and after 15minutes of polling, you should be able to see graphs in the Custom Graphs part of the device:
